By Ruslan Averin.
Uber reported second-quarter revenue of $14.19 billion, up 12% year over year, with gross bookings up 24% and trips up 18% to 3.87 billion. GAAP diluted earnings per share were $1.17 against $0.63 a year earlier. Adjusted earnings per share of $0.81 missed the $0.83 expected by 2.4%. The shares closed 5.3% lower.
The quarter
| Metric | Q2 2026 | Change |
|---|---|---|
| Revenue | $14.19B | +12% |
| Gross bookings | — | +24% |
| Trips | 3.87B | +18% |
| Mobility gross bookings | $28.99B | +22% |
| Delivery gross bookings | $27.46B | +26% |
| GAAP diluted EPS | $1.17 | from $0.63 |
| Adjusted EPS | $0.81 | vs $0.83 expected |
The gap between bookings and revenue
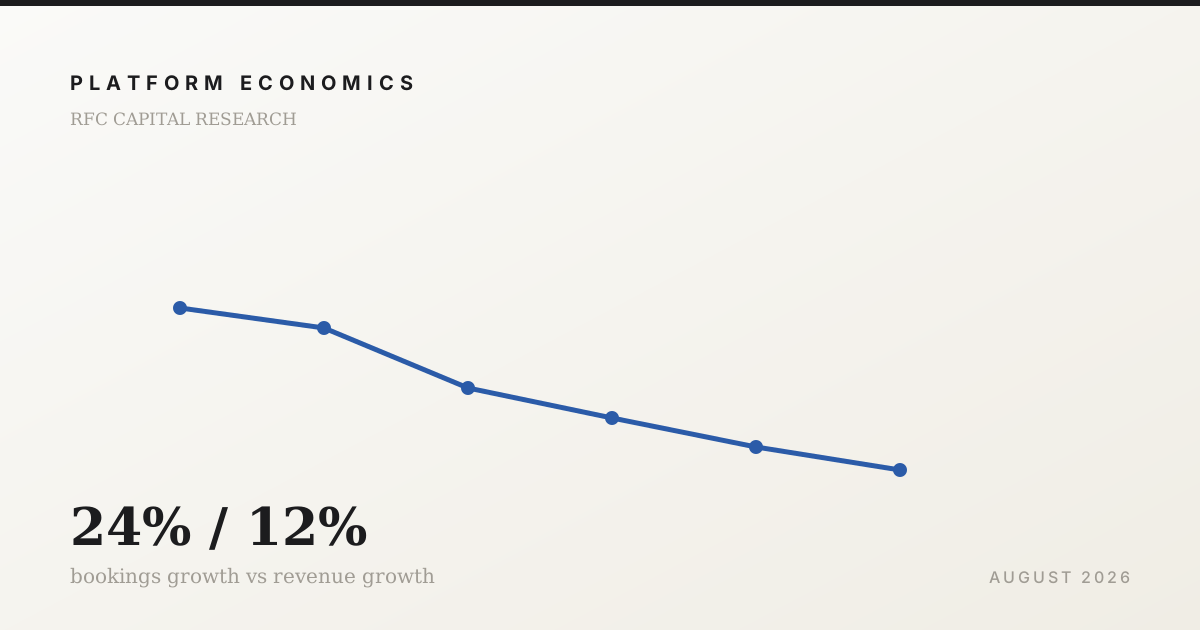
The most important relationship in this release is that gross bookings grew 24% while revenue grew 12%.
Gross bookings measure the total value transacted across the platform. Revenue is what the company retains. Bookings growing at twice the rate of revenue means the retained share of each transaction — the take rate — declined.
That can happen for several reasons, and they have different implications:
Mix. Delivery bookings grew 26% against mobility's 22%. If delivery carries a lower retained share, faster growth in the lower-take segment mechanically reduces the blended rate without any pricing decision.
Incentives. Payments to drivers, couriers and riders reduce the retained share directly. Rising incentive spend usually indicates competitive pressure or supply constraints.
Deliberate pricing. Lowering the take rate to accelerate volume is a strategic choice with a defensible logic, and it looks identical in the aggregate numbers.
The company's explanation of which of these dominates is the substantive question, and it is not answerable from headline figures.
Why a 2.4% earnings miss moved the stock
On its own it would not. What produced the reaction is the combination: very strong volume growth alongside earnings that fell slightly short.
That pairing supports the least favourable reading — that growth is being purchased. A platform generating 24% booking growth while missing on profitability invites the question of what the growth costs, and 18% trip growth against 12% revenue growth suggests the answer involves price.
For a company whose investment case has shifted from growth to profitable growth, missing on the profitability half while excelling on the growth half is a challenge to the thesis rather than to the quarter.
What to watch
Take rate by segment. Reported separately for mobility and delivery, this resolves the mix-versus-incentives question directly.
Incentive spend as a share of bookings. The clearest measure of what the volume growth costs.
Free cash flow conversion. The metric the equity story now rests on, and the one least affected by the accounting treatment of incentives.
Trips per user. Growth from more users behaves differently from growth in frequency; the latter is the higher-quality source and indicates the product is embedding.
Conclusion
Bookings up 24%, trips up 18% and revenue up 12% describe a platform gaining volume while retaining less of each transaction. Whether that is segment mix or purchased growth determines whether the quarter was good, and the two-cent earnings miss was the market's excuse to ask.
This is analysis, not investment advice.