The number that decides the quarter
Everything in Lennar's August quarter reduces to one line item: the cost of buying down a customer's mortgage rate. That cost equalled 14.5% of the sales price in the November 2025 quarter, 14.1% in February and 12.9% in May. Stuart Miller called the May figure the start of "the first real and potentially sustainable decline" after three years of generally rising incentives, and pegged a normal level at 4–6%.
That claim carried an assumption. It was made with the 30-year fixed at 6.4–6.5%. Freddie Mac's weekly survey for 10 September put the rate at 6.76%, up from 6.71% the prior week and 6.35% a year earlier, while Mortgage News Daily's daily index printed 7.17% on 14 September, the highest since January 2025. Buydowns get more expensive as market rates climb.
Margins have compressed for six of seven quarters
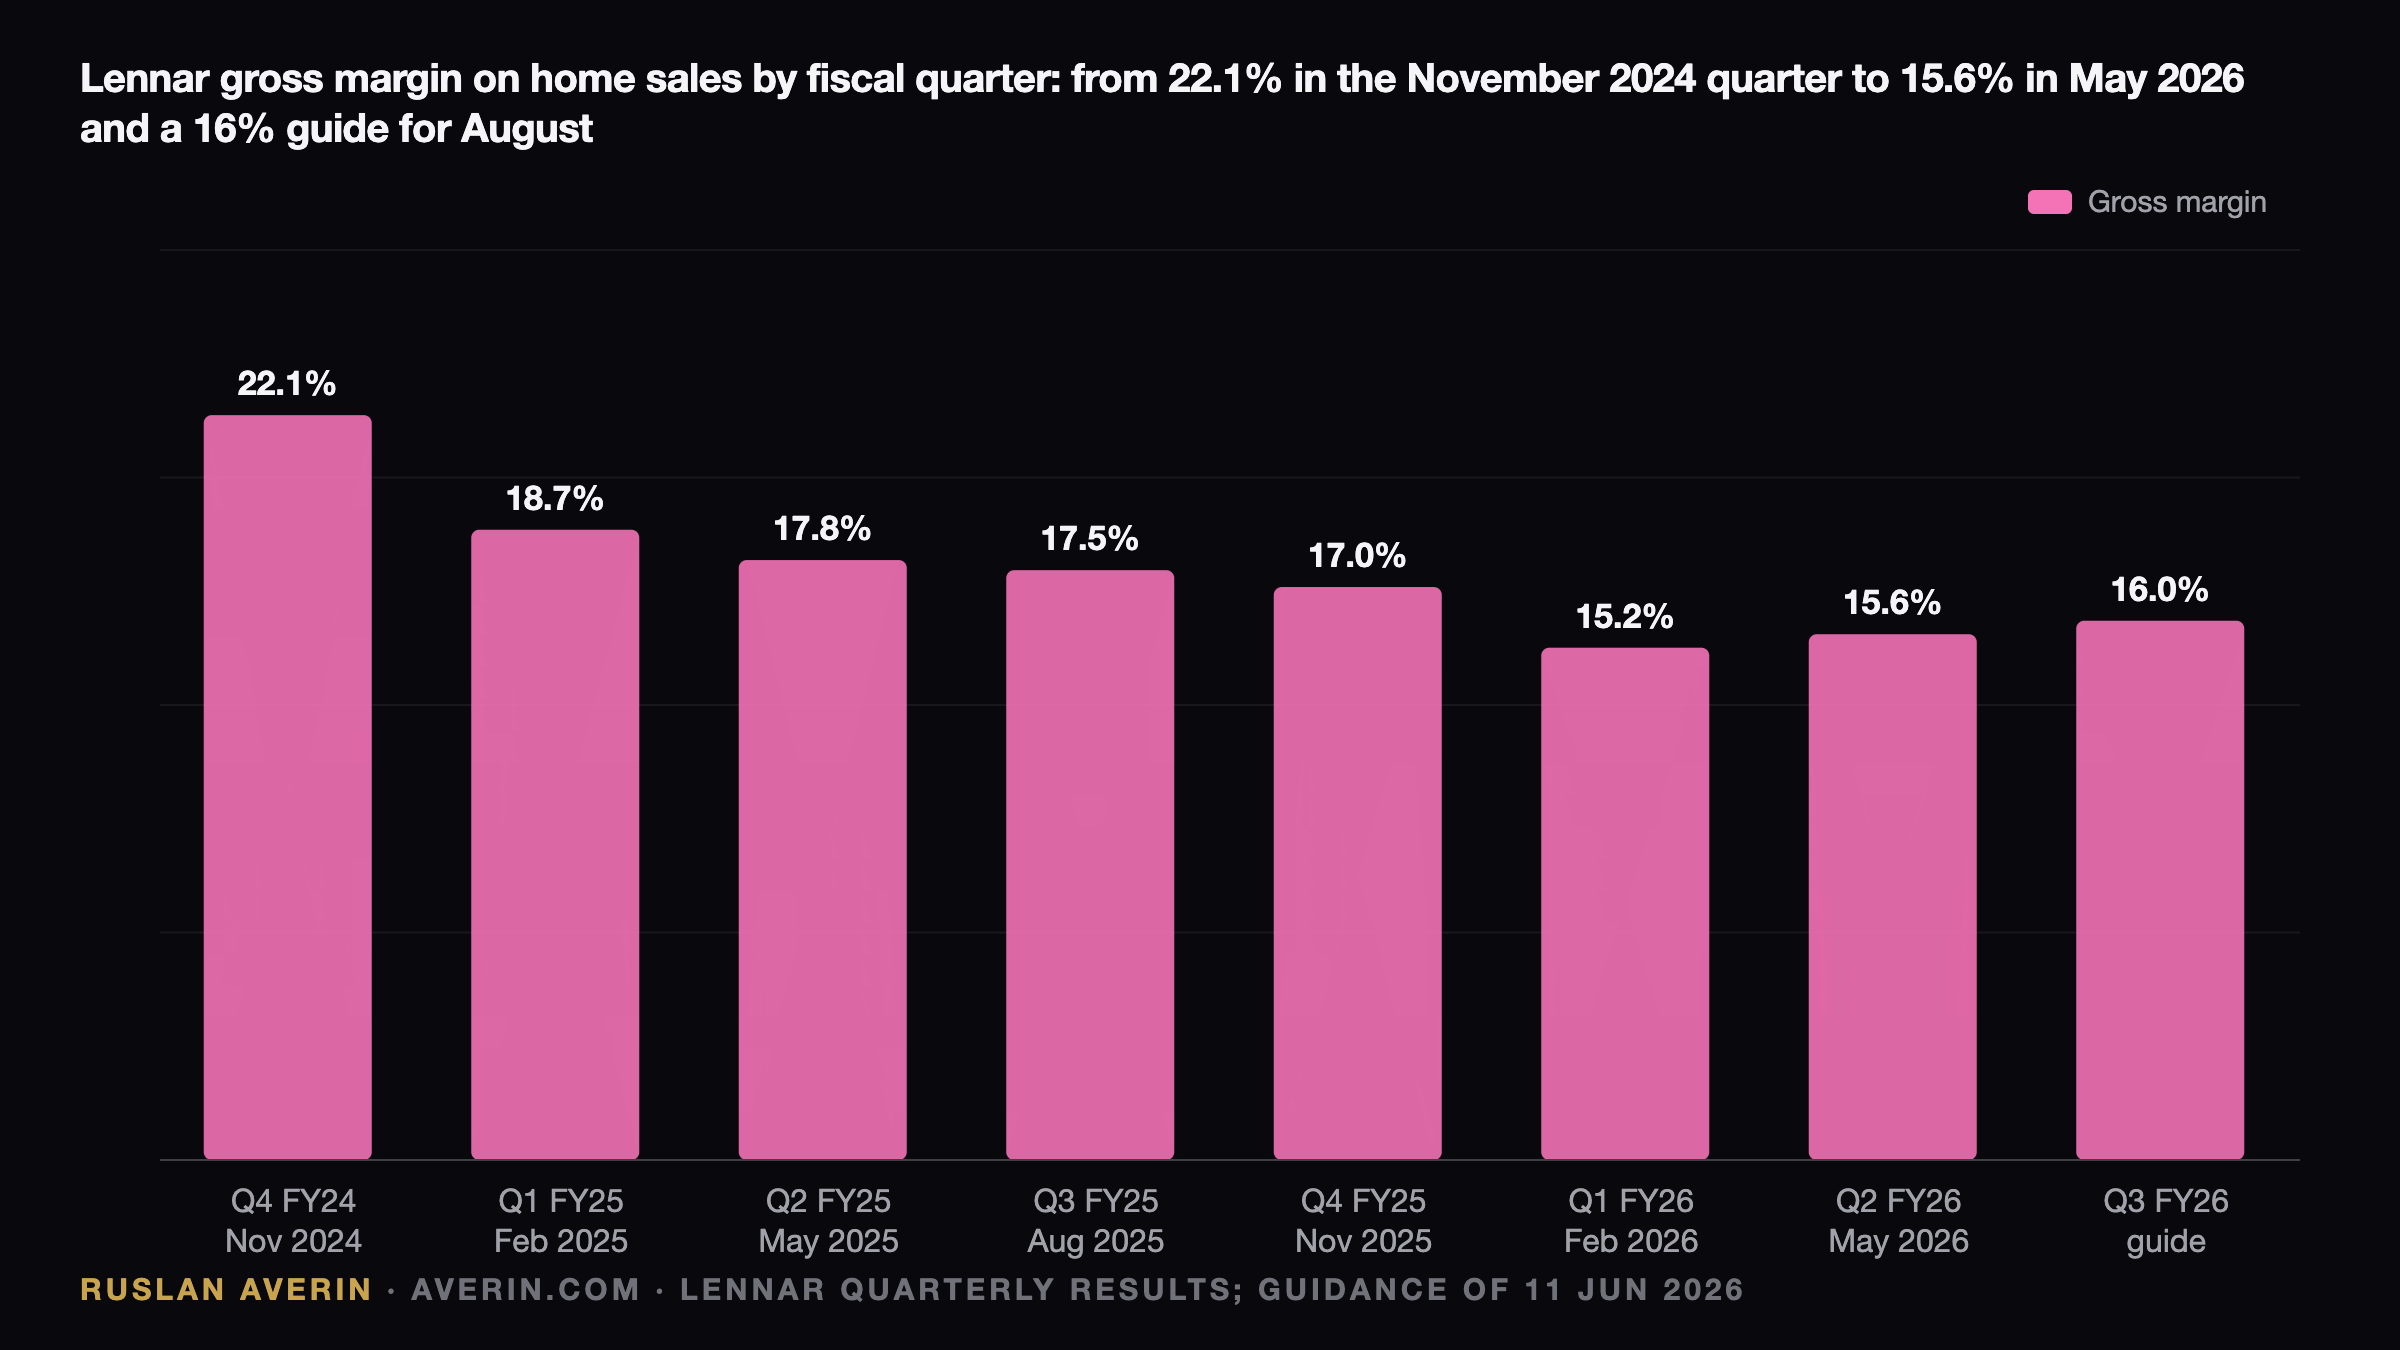
The gross margin on home sales was 22.1% in the November 2024 quarter. Since then the sequence reads 18.7%, 17.8%, 17.5%, 17.0%, 15.2% and 15.6% in May. Six declines in seven quarters, with a single stabilising tick at the end. Management's guide of roughly 16% for the August quarter assumes that tick was the beginning of a trend rather than noise inside a downcycle.
A Fed decision two hours before the print
The Federal Open Market Committee announces at 2:00 pm ET on 16 September, with futures assigning roughly 91% odds to a 25 basis point increase to 3.75–4.00%. The direct effect on Lennar is negligible, because its buyers borrow against the 10-year, not the funds rate. The indirect effect runs through the dot plot: a median showing two further hikes in 2026 gives the long end no reason to retreat below 5%.
Guidance, consensus and the prior year
| Metric | Q2 FY2026 (May) | Q3 FY2026 guide (Aug) | Consensus |
|---|---|---|---|
| Deliveries | 20,519 | 20,500–21,500 | ~21,000 |
| Average sales price | $371,000 | $375,000–380,000 | — |
| Gross margin | 15.6% | ~16% | 16.0% |
| Incentives, % of price | 12.9% | not guided | below 12.9% hoped |
| New orders | 21,749 | 21,000–22,000 | — |
| EPS | $1.24 GAAP, $1.31 adjusted | $1.20–1.40 | $1.30 |
Consensus sits at the midpoint: EPS around $1.30 on revenue near $8.37 billion. The comparable quarter a year earlier produced $2.00 on $8.81 billion. The May quarter itself missed on revenue, delivering $7.94 billion against roughly $8.13 billion expected, and the shares fell 4.6% the following session.
How the tape has already voted
From about $91 after that miss, the stock reached $79.62 at midday on 15 September, a 44% discount to the 52-week high of $140.71. Trailing P/E stands at 12.4 and price-to-book at about 0.89. On 14 September BofA cut its target to $70 with an Underperform rating, valuing the shares at 0.9 times forward tangible book and citing continued pressure on return on tangible equity.
Sector data lands on both sides of the call
Builder confidence has stayed below 40 for sixteen months. The NAHB index registered 35 in August, with 35% of builders cutting prices by an average of 6% and 63% offering incentives; the September reading arrives at 10:00 am ET on 16 September against a consensus of 34. August housing starts follow at 8:30 am on 17 September, the morning of the call. July starts fell 12.4% in the month to a 1.239 million annual rate, and new-home supply reached 9.6 months with 488,000 homes for sale, the highest of this cycle.
Peers give no clean read
D.R. Horton beat on earnings for its June quarter, reported on 21 July, with EPS of $3.20 at a 20.7% gross margin, yet trimmed full-year closings to 83,800–84,300, said incentives would "remain elevated" and disclosed a cancellation rate of 20% against 17% a year earlier, with qualification the main cause. Lennar publishes no cancellation figure at all. Toll Brothers, serving a buyer at an average price of $996,400, held its full-year margin guide at 26.1% and grew contracts 5%. KB Home's revenue fell 27%. ITB is down 21.6% in 2026 and within 5% of its 52-week low; XHB is down 15.6% over a year.
The land-light trade-off
Since the Millrose spin-off in February 2025, Lennar controls homesites while owning less than 5% of them, repurchasing land just in time. The balance sheet benefits, with cash of $1.8 billion and debt to total capital of 15.8% in May. The cost is that option payments flow through cost of sales, capping how far margins can rebound. That mechanism sits at the centre of the bear case on return on tangible equity in a 7% mortgage market.
The Q4 guide outranks the quarter
The November 2025 quarter delivered 23,034 homes at a 17.0% margin. A fourth-quarter guide of 22,000–23,000 deliveries at 16% would read as holding the line; anything below 15.5% would signal the incentive floor giving way. Full-year deliveries have already been cut once, to 82,000–83,000 from about 85,000. In analyst Ruslan Averin's view, the forward number carries more information than the reported one.
Positioning ahead of Wednesday
LEN has moved beyond its options-implied range in four of the last eight quarters, and this print has a central bank decision stacked in front of it. For holders, Thursday's call reduces to a single question: did incentives rise or fall from 12.9%? A discount of 0.89 times book and a tangible book of $74 only make sense if margins hold at 15–16%.
Ruslan Averin argues the cleaner expression of the same view lies in the long end of the Treasury curve, where a 5% 10-year is the cause rather than the symptom, and the position pays a coupon while it waits.