A release with two personalities
The Bureau of Labor Statistics publishes September 2026 consumer price data on Wednesday 14 October at 8:30 a.m. New York time. The report carries two numbers that point in different directions: a headline rate lifted almost mechanically by fuel, and a core rate that has been easing for three consecutive months. The distance between them is the trade.
It is also the final inflation reading before the Federal Reserve convenes on 27–28 October, and the first since the Committee lifted its target range to 3.75–4.00% on 16 September. The headline is close to settled. The core figure is where the October decision is argued.
The pump wrote the headline in advance
Weekly Energy Information Administration survey data left little room for doubt. The average US retail price of gasoline across all grades was $4.295 a gallon on 7 September, $4.455 on 14 September, $4.610 on 21 September and $4.603 on 28 September. That averages roughly $4.49 for the month against about $4.19 in August, an increase of roughly 7%.
Against a September 2025 average near $3.29, pump prices stood about 36% higher year on year. The latest EIA reading of $4.496 on 5 October indicates the climb stalled without reversing. Because the unadjusted all-items index rose only 0.25% in September 2025, the base effect is weak and the annual rate rises by roughly whatever the monthly print exceeds 0.25%.
What forecasters have on the board
| Measure | August actual | Consensus (Sep) | Trading Economics | Continuum Economics |
|---|---|---|---|---|
| Headline month on month | 0.4% | 0.6% | 0.5% | 0.6% |
| Headline year on year | 3.4% | 3.7% | 3.6% | 3.7% |
| Core month on month | 0.3% | 0.2% | — | 0.2% |
| Core year on year | 2.4% | 2.5% | 2.4% | 2.4% |
Continuum Economics, in a preview dated 29 September, puts the headline at 0.57% before rounding and energy up about 5.5%. Its core estimate is 0.19% unrounded, with CPI excluding food, energy and shelter slowing to 0.17% from 0.31% in August.
The rounding trap inside the core consensus
Unrounded core inflation ran at 2.45% in August, sitting exactly on the rounding boundary. The unadjusted core index rose 0.25% in September 2025, so a monthly core near 0.2% this year maps more naturally to 2.4% than to 2.5%. A printed 2.5% would not, on its own, demonstrate acceleration.
That is why the monthly figure carries the information rather than the annual one. Headlines will report the year-on-year core, but the arithmetic behind it can shift a tenth on rounding alone, which is a poor basis for a policy conclusion.
Where August left the picture
The 11 September release showed all-items prices up 0.4% seasonally adjusted and 3.4% over twelve months, with core up 0.3% monthly and 2.4% annually. Energy supplied the gap: the energy index rose 2.1% on the month and 16.3% on the year, while gasoline gained 3.9% monthly and 27.4% year on year.
Food stayed quiet at 0.1% monthly and 2.7% annually. Shelter rose 0.3% on the month and 3.0% over twelve months, with owners' equivalent rent up 0.2%.
A year shaped entirely by fuel
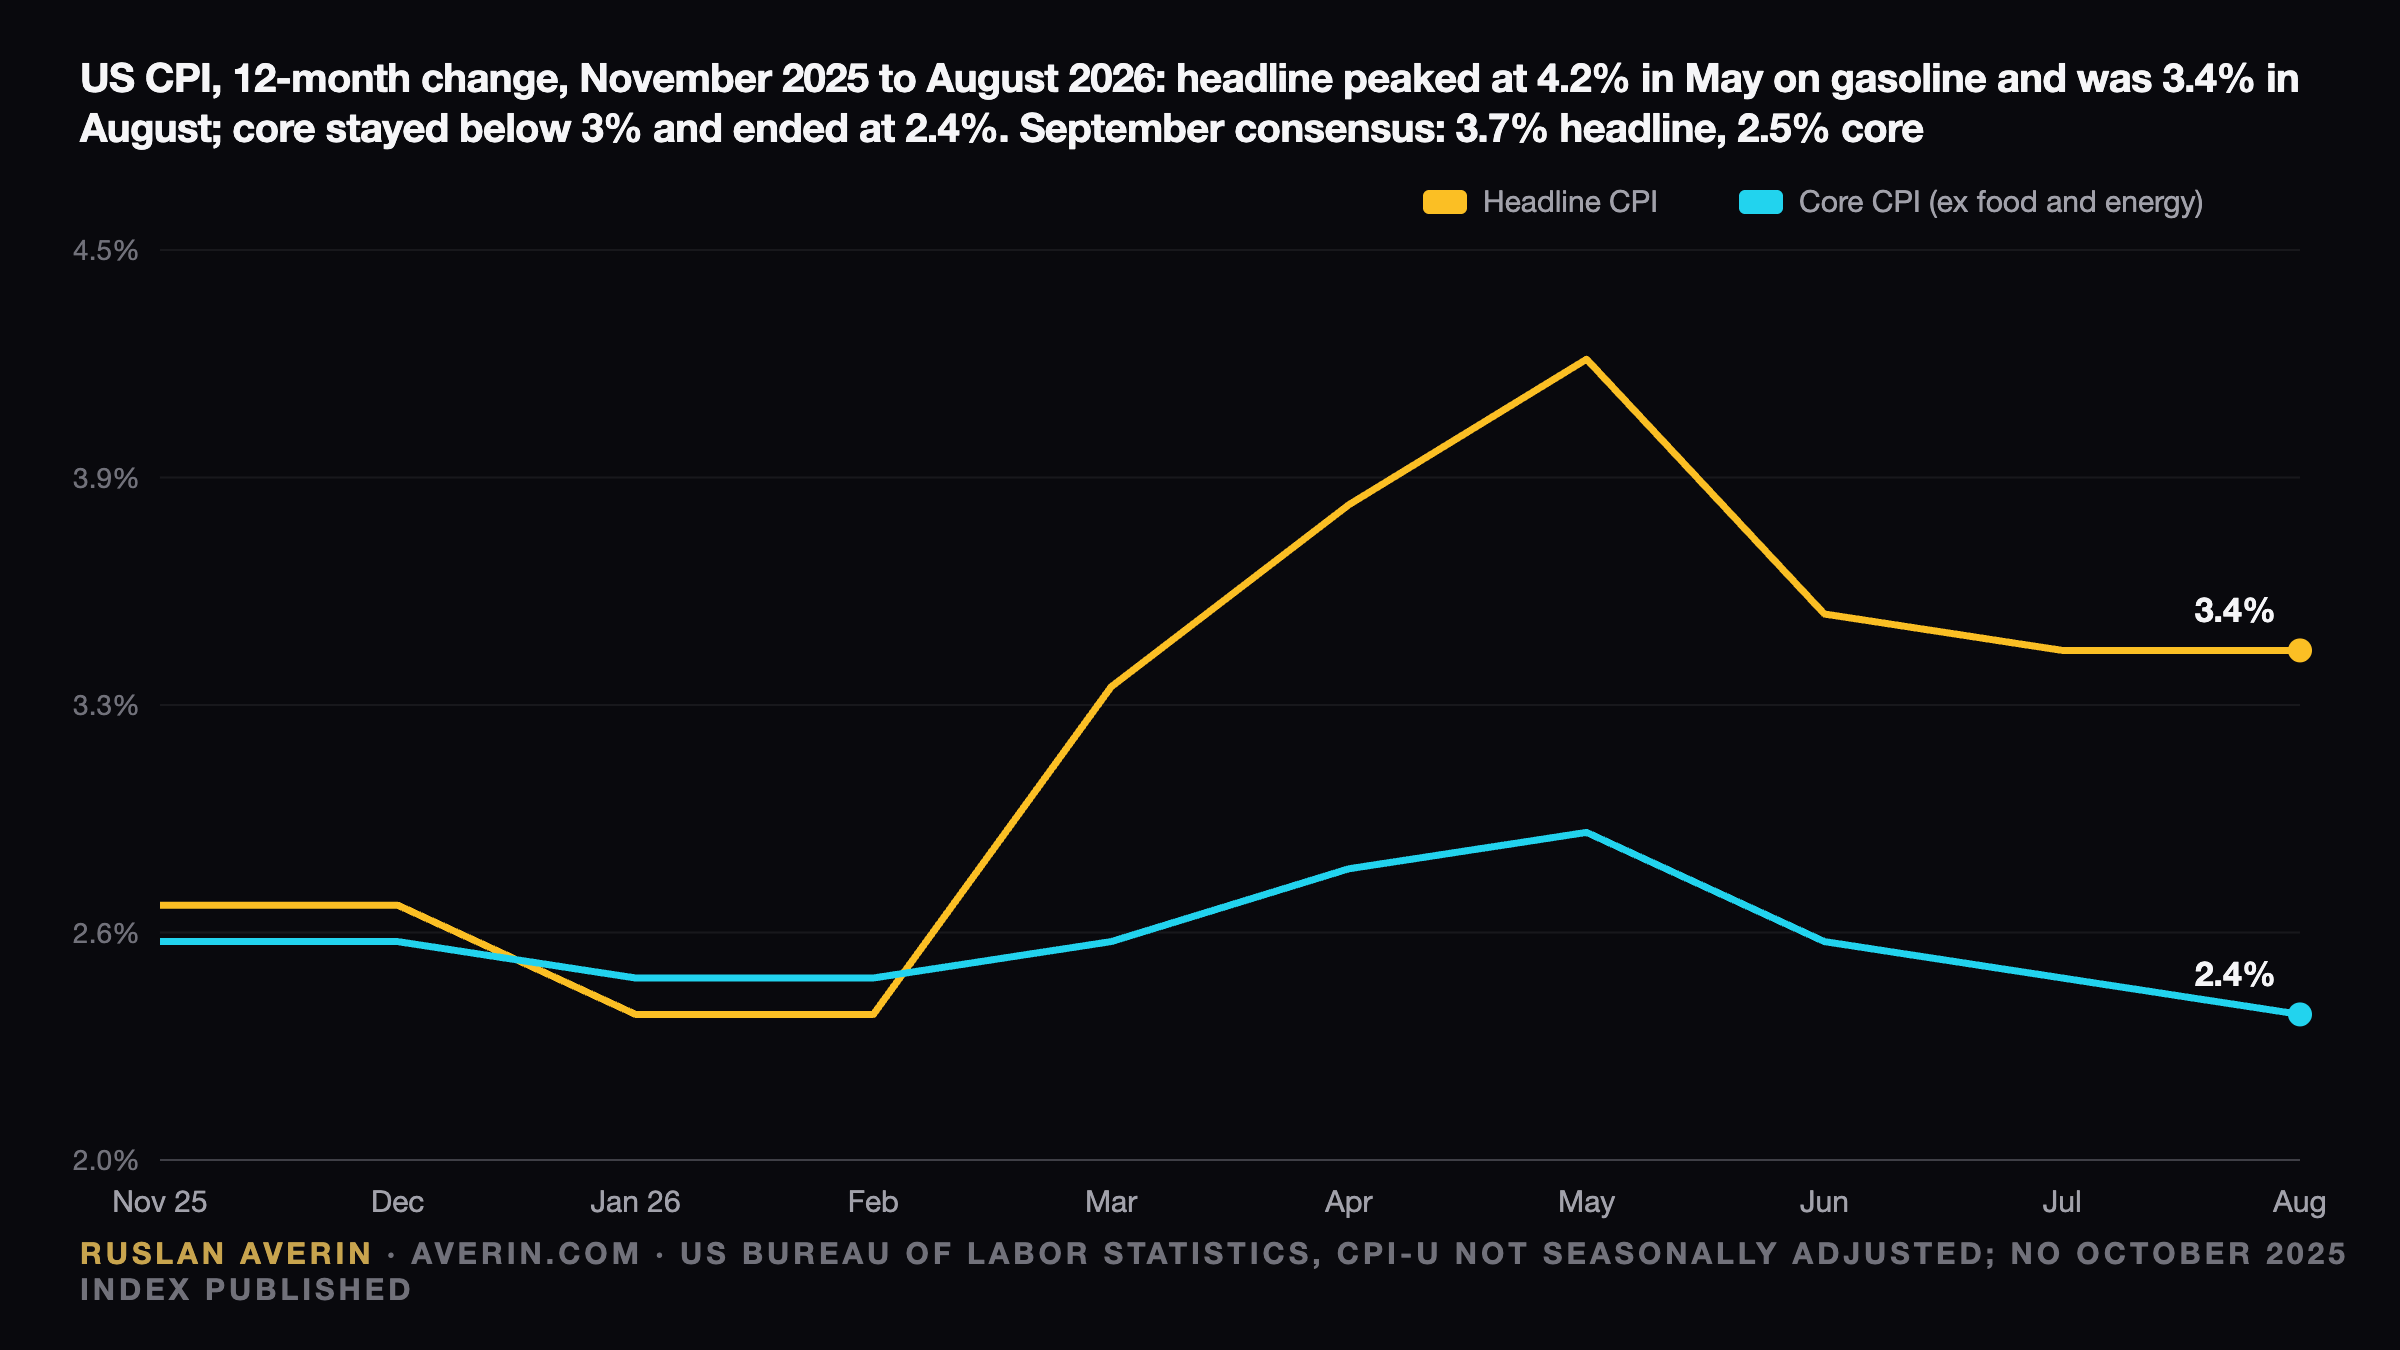
Headline inflation registered 2.4% in January and February, jumped to 3.3% in March and peaked at 4.2% in May, when gasoline was running about 40% above year-ago levels. A monthly decline of 0.4% in June pulled the annual rate back to 3.5%.
Core never mirrored that path. It topped out near 2.9% in May and has drifted lower since. The BLS published no index for October 2025, which is why the comparison series begins in November.
The three lines that matter in the detail
Shelter is the heaviest component of the basket and now runs at 3.0% annually, down from 3.6% in September 2025. A monthly reading of 0.2% to 0.3% would keep it on that glide path. The sensitive categories are those where fuel passes through with a lag: airline fares, transportation services and trucked goods.
In analyst Ruslan Averin's view, the first evidence that energy is leaking into core would surface in those lines rather than in rent. The watchlist runs in order: core month on month, where 0.2% is consensus and 0.3% or more marks a second firm month; core excluding shelter, benchmarked against Continuum's 0.17%, with anything above 0.3% signalling pass-through; and airline fares plus transportation services.
Bonds moved before the data did
The 16 September decision was unanimous at 12–0. The statement described inflation as "elevated" and said the hike "will support a timelier return to the Committee's 2 percent goal". October brings no projections; the next dot plot arrives on 8–9 December.
Treasury yields have already priced further tightening. On Friday 9 October the 2-year closed at 4.80% against 4.67% on 15 September, above the top of the 3.75–4.00% range. The 10-year finished at 5.24%, up from 5.00%, and the 30-year at 5.60%. Monday 12 October was the Columbus Day bond holiday; the Cboe 10-year index ended at the same 5.24%.
Three scenarios for 28 October
The S&P 500 closed Monday 12 October at 7,807.24, barely changed from 7,811.54 on Friday, with the ICE dollar index at 102.58.
A hot core of 0.3% or more strengthens the case for a second hike. The 2-year would likely lead; a 10-year move of 10 basis points equates to a price change of roughly 0.8% on a 10-year bond. The dollar would firm and equity valuations, already stretched against a 5.24% risk-free yield, would come under pressure.
An in-line print of 3.7% headline with 0.2% core lets markets look through the fuel effect, implying a modest move and a debate deferred to December. A cool core of 0.1% or below would support the argument that September's hike sufficed and could pull the 2-year toward 4.67%, though long yields may fall less: the 10-year rose 24 basis points after the hike, much of it term premium.
The asymmetry, as Ruslan Averin frames it, is that an elevated headline with a soft core is already expected, while a firm core is not.
Currency and duration for non-dollar savers
A hot print typically supports the dollar. For a euro-based investor, that currency gain can offset price losses on US bonds and equities, sometimes exceeding the yield move itself. For a Ukrainian saver holding dollars, a firm dollar protects purchasing power abroad, while the National Bank of Ukraine's key rate of 16% remains the domestic benchmark for hryvnia deposits.
The practical question is duration. With the 1-year Treasury bill at 4.47% and the 10-year at 5.24%, most of the available yield is obtainable without heavy rate risk. A second firm core reading would make that trade-off more relevant, not less.