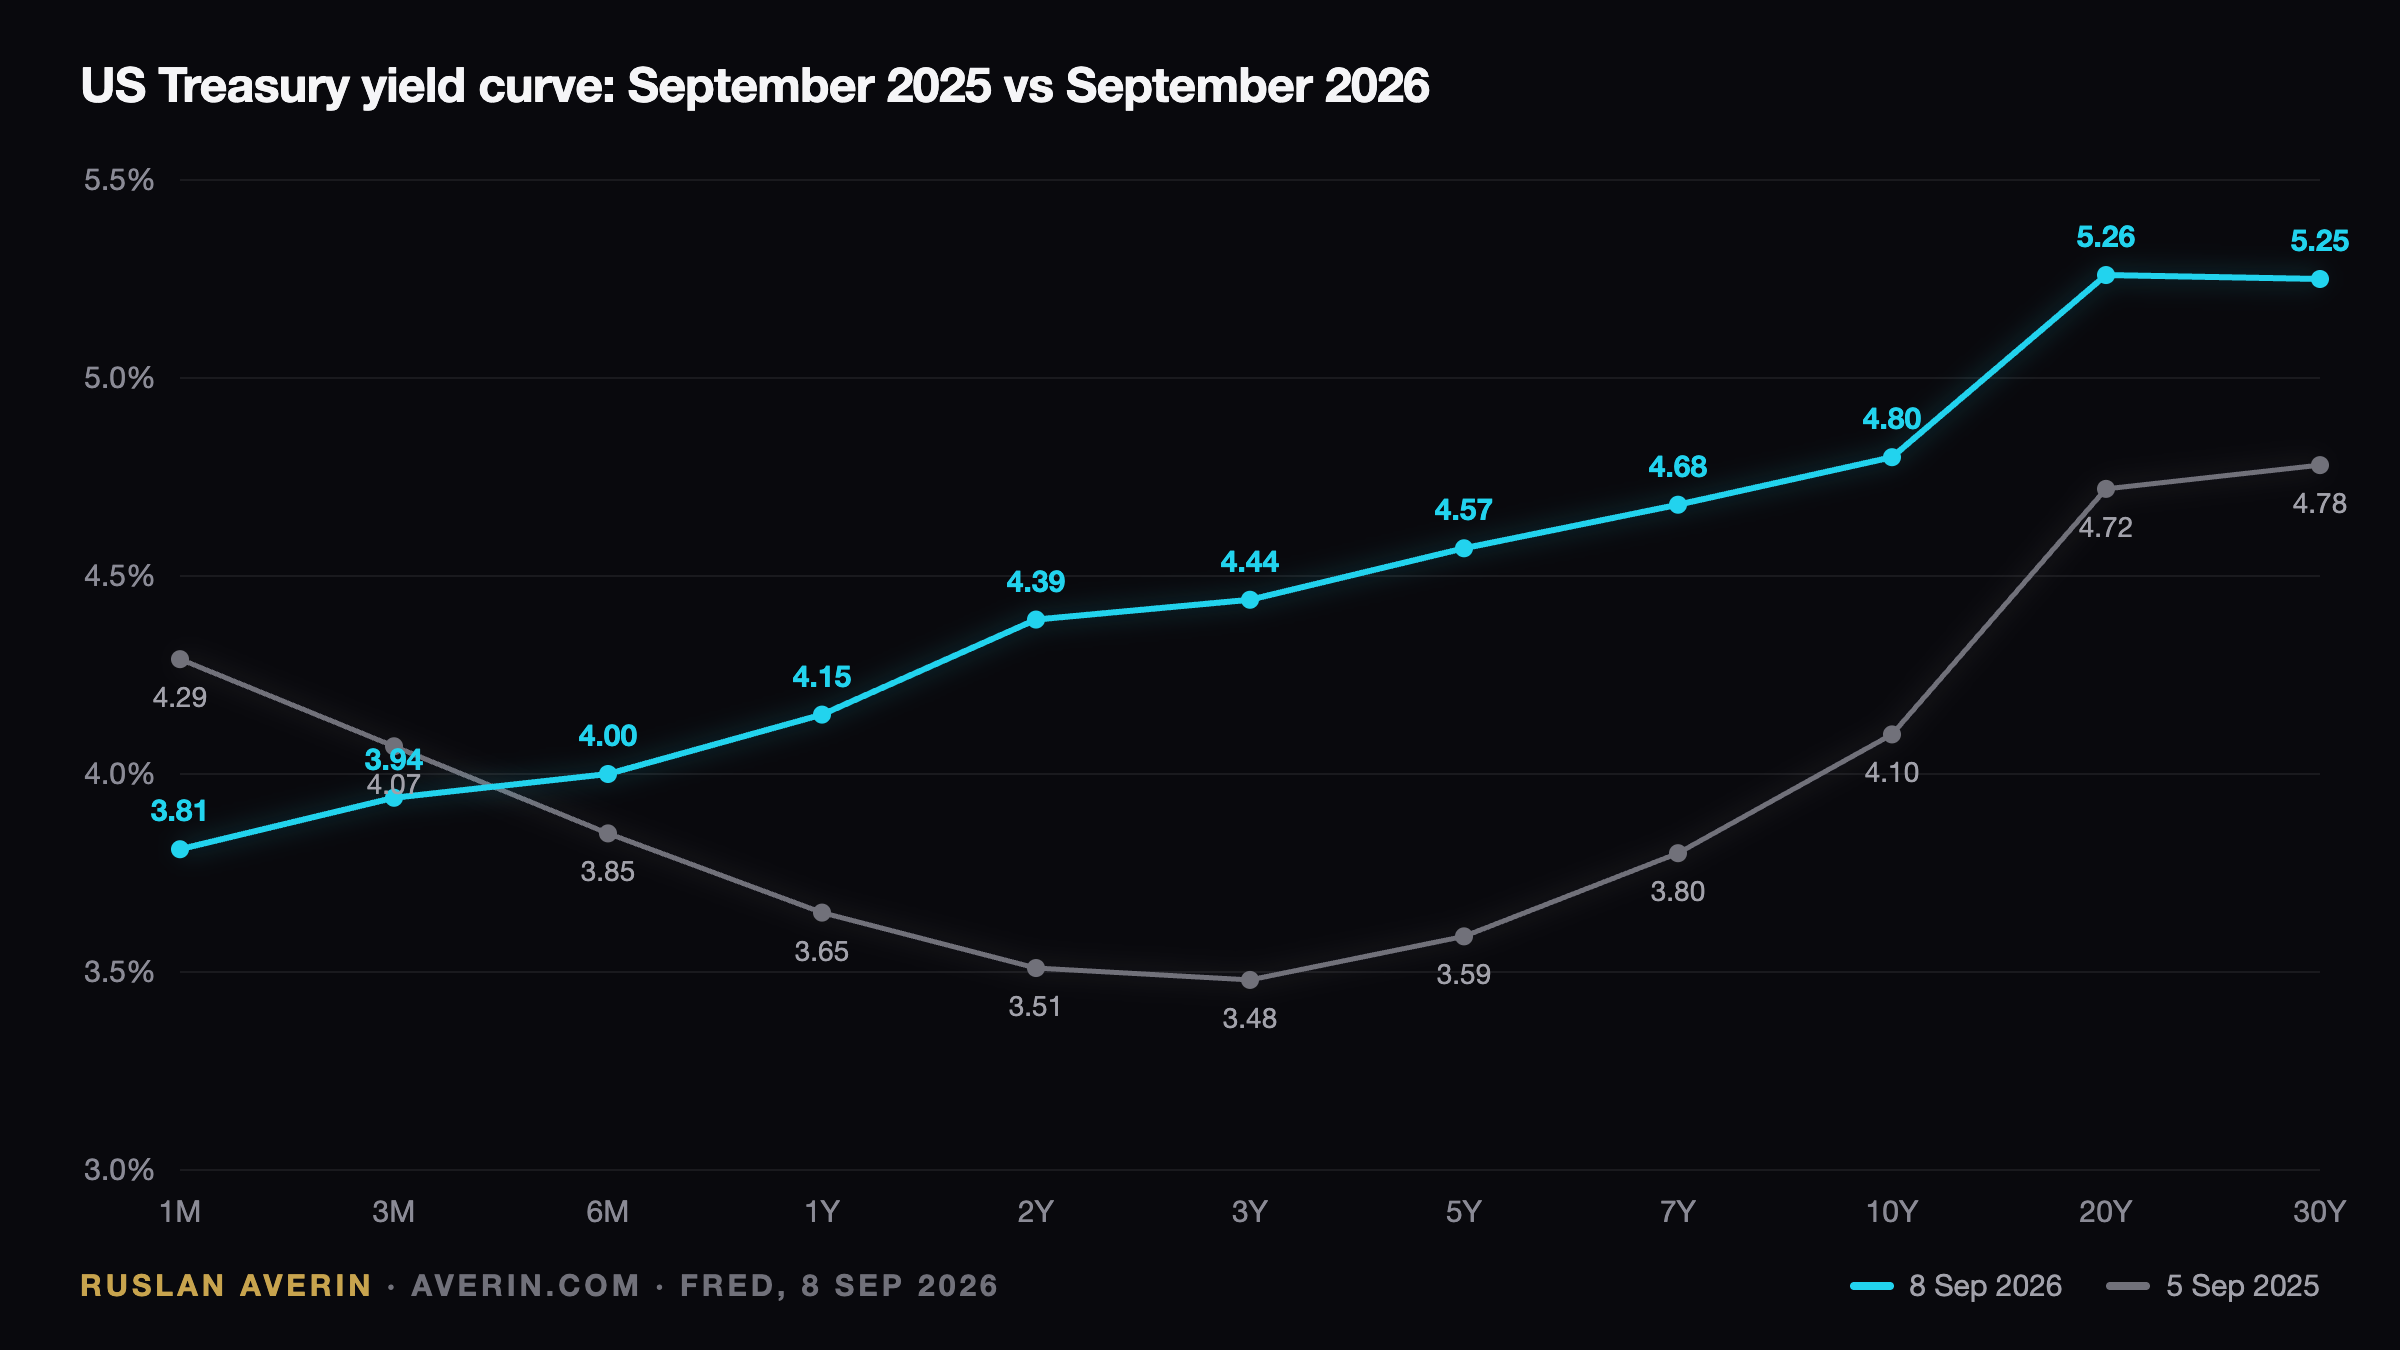
The Two-Year Note Did the Tightening
The clearest single number in the 2026 Treasury market is not the 10-year. It is the two-year note, which began the year at 3.47% and prints 4.39% on 8 September. The two-year is essentially a wager on the next two years of policy, and it has moved almost a full percentage point without the Federal Reserve touching the target range once.
That range has sat at 3.50–3.75% since December, following three cuts in the autumn of 2025. Every meeting since has ended in a hold. Meanwhile the 10-year climbed from 4.19% to 4.80% and the 30-year from 4.86% to 5.25%. The central bank stayed put; the market tightened on its behalf.
Three Forces Doing the Work
Inflation stopped falling. Headline CPI was 3.4% in July 2026, with the energy index up 14.7% year over year on oil prices that have not retreated since the Iran war began. Core CPI at 2.5% reads better, but the Fed does not get to consume only the core. The market has watched the last mile of disinflation stall for a full year.
Then came the chair. Kevin Warsh's Jackson Hole address in late August was widely read as guidance that the next move is up rather than down. Rate futures swung from pricing cuts to pricing roughly a 56% chance of a 25 basis point hike at the 15–16 September meeting.
Supply is the third leg. Debt held by the public crossed $40 trillion and reached 100% of GDP in August, with the 12-month deficit running at $1.8 trillion. Treasury sells that paper into a market where Japan has been a net seller defending the yen and where corporate issuers, AI capex borrowers above all, have brought north of $1.5 trillion this year.
The Curve, Maturity by Maturity
| Maturity | 5 Sep 2025 | 8 Sep 2026 | Change |
|---|---|---|---|
| 1 month | 4.29% | 3.81% | −0.48% |
| 3 months | 4.07% | 3.94% | −0.13% |
| 6 months | 3.85% | 4.00% | +0.15% |
| 1 year | 3.65% | 4.15% | +0.50% |
| 2 years | 3.51% | 4.39% | +0.88% |
| 3 years | 3.48% | 4.44% | +0.96% |
| 5 years | 3.59% | 4.57% | +0.98% |
| 7 years | 3.80% | 4.68% | +0.88% |
| 10 years | 4.10% | 4.80% | +0.70% |
| 20 years | 4.72% | 5.26% | +0.54% |
| 30 years | 4.78% | 5.25% | +0.47% |
Only the one-month bill pays less than a year ago, at 3.81% against 4.29%, because it tracks the policy rate and the policy rate was cut. From one year outward, every maturity pays more, with the belly of the curve — three to five years — up close to a full percentage point. A year ago bills at 4.29% sat above the two-year at 3.51%. That inversion is gone.
Real Yields Change the Arithmetic
Strip inflation out and the numbers look nothing like the post-2008 decade. The 10-year TIPS real yield stands at 2.43%, and the 10-year breakeven inflation rate at 2.37%. The two components sum to the 4.80% nominal, which makes the composition unusually easy to read for anyone weighing whether the compensation is for prices or for risk.
Through most of the 2010s the 10-year real yield sat below 1% and spent stretches in negative territory. A promised 2.43% a year above realised inflation is a genuine return. Analyst Ruslan Averin notes that this is precisely why the asset class has become interesting again rather than merely uncomfortable to hold.
The condition attached has not changed. The real yield is locked only for a buyer who holds to maturity. Anyone marking positions daily remains exposed to the next move in nominal yields, and that move has gone one direction for nine months. Investors who bought duration in January on a "the Fed is done, yields fall next" thesis are carrying price losses that the coupon no longer offsets.
One Basis Point Backwards at the Far End
The 20-year Treasury yields 5.26% while the 30-year yields 5.25%. The longest bond on the curve pays a basis point less than the maturity ten years shorter, which is not a forecast about the 2050s but a plumbing issue. Reintroduced in 2020, the 20-year has a thinner natural buyer base and usually trades cheap to the curve.
The practical consequence is narrow but real: an investor hunting maximum coupon per unit of duration should be looking at the 20-year, not the reflexive 30-year choice.
What the Shape Actually Signals
A 10-year/2-year spread of +0.40% and a 10-year/3-month spread of +0.88% describe a textbook late-cycle steepener. Short rates are anchored by a central bank unsure of its next direction; long rates are lifted by inflation risk and issuance. This is not a recession signal. The 2023–2025 inversion carried that reputation, and the recession never arrived.
What the curve does say is that the market no longer believes the Fed can cut its way past a 3.4% CPI print with oil where it is. In the judgement of analyst Ruslan Averin, the 2025 easing cycle is finished as far as pricing is concerned. Whether 16 September delivers a hike or a hold with hawkish language, the long end has already positioned for a Fed that has stopped easing.