The Session That Exposed the Problem
Between Tuesday 22 and Wednesday 23 September the classic balanced portfolio did the opposite of its job. The 10-year Treasury yield climbed from 4.968% to 5.114%. The S&P 500 slipped 0.76%. Instead of absorbing the blow, the aggregate bond index fell 0.87% and long Treasuries dropped 1.58%.
A blend of 60% SPY and 40% AGG shed roughly 0.80% that day. The detail that matters is not the size of the loss but its source: the defensive half lost more than the risk half. That inversion is the entire question facing allocators heading into the fourth quarter.
Two days later, on Thursday 24 September, the 10-year touched 5.208%, the highest level since June 2007, and settled at 5.18% on the Federal Reserve's constant-maturity series. The 30-year ended the week near 5.50%.
A Year That Looks Fine on the Surface
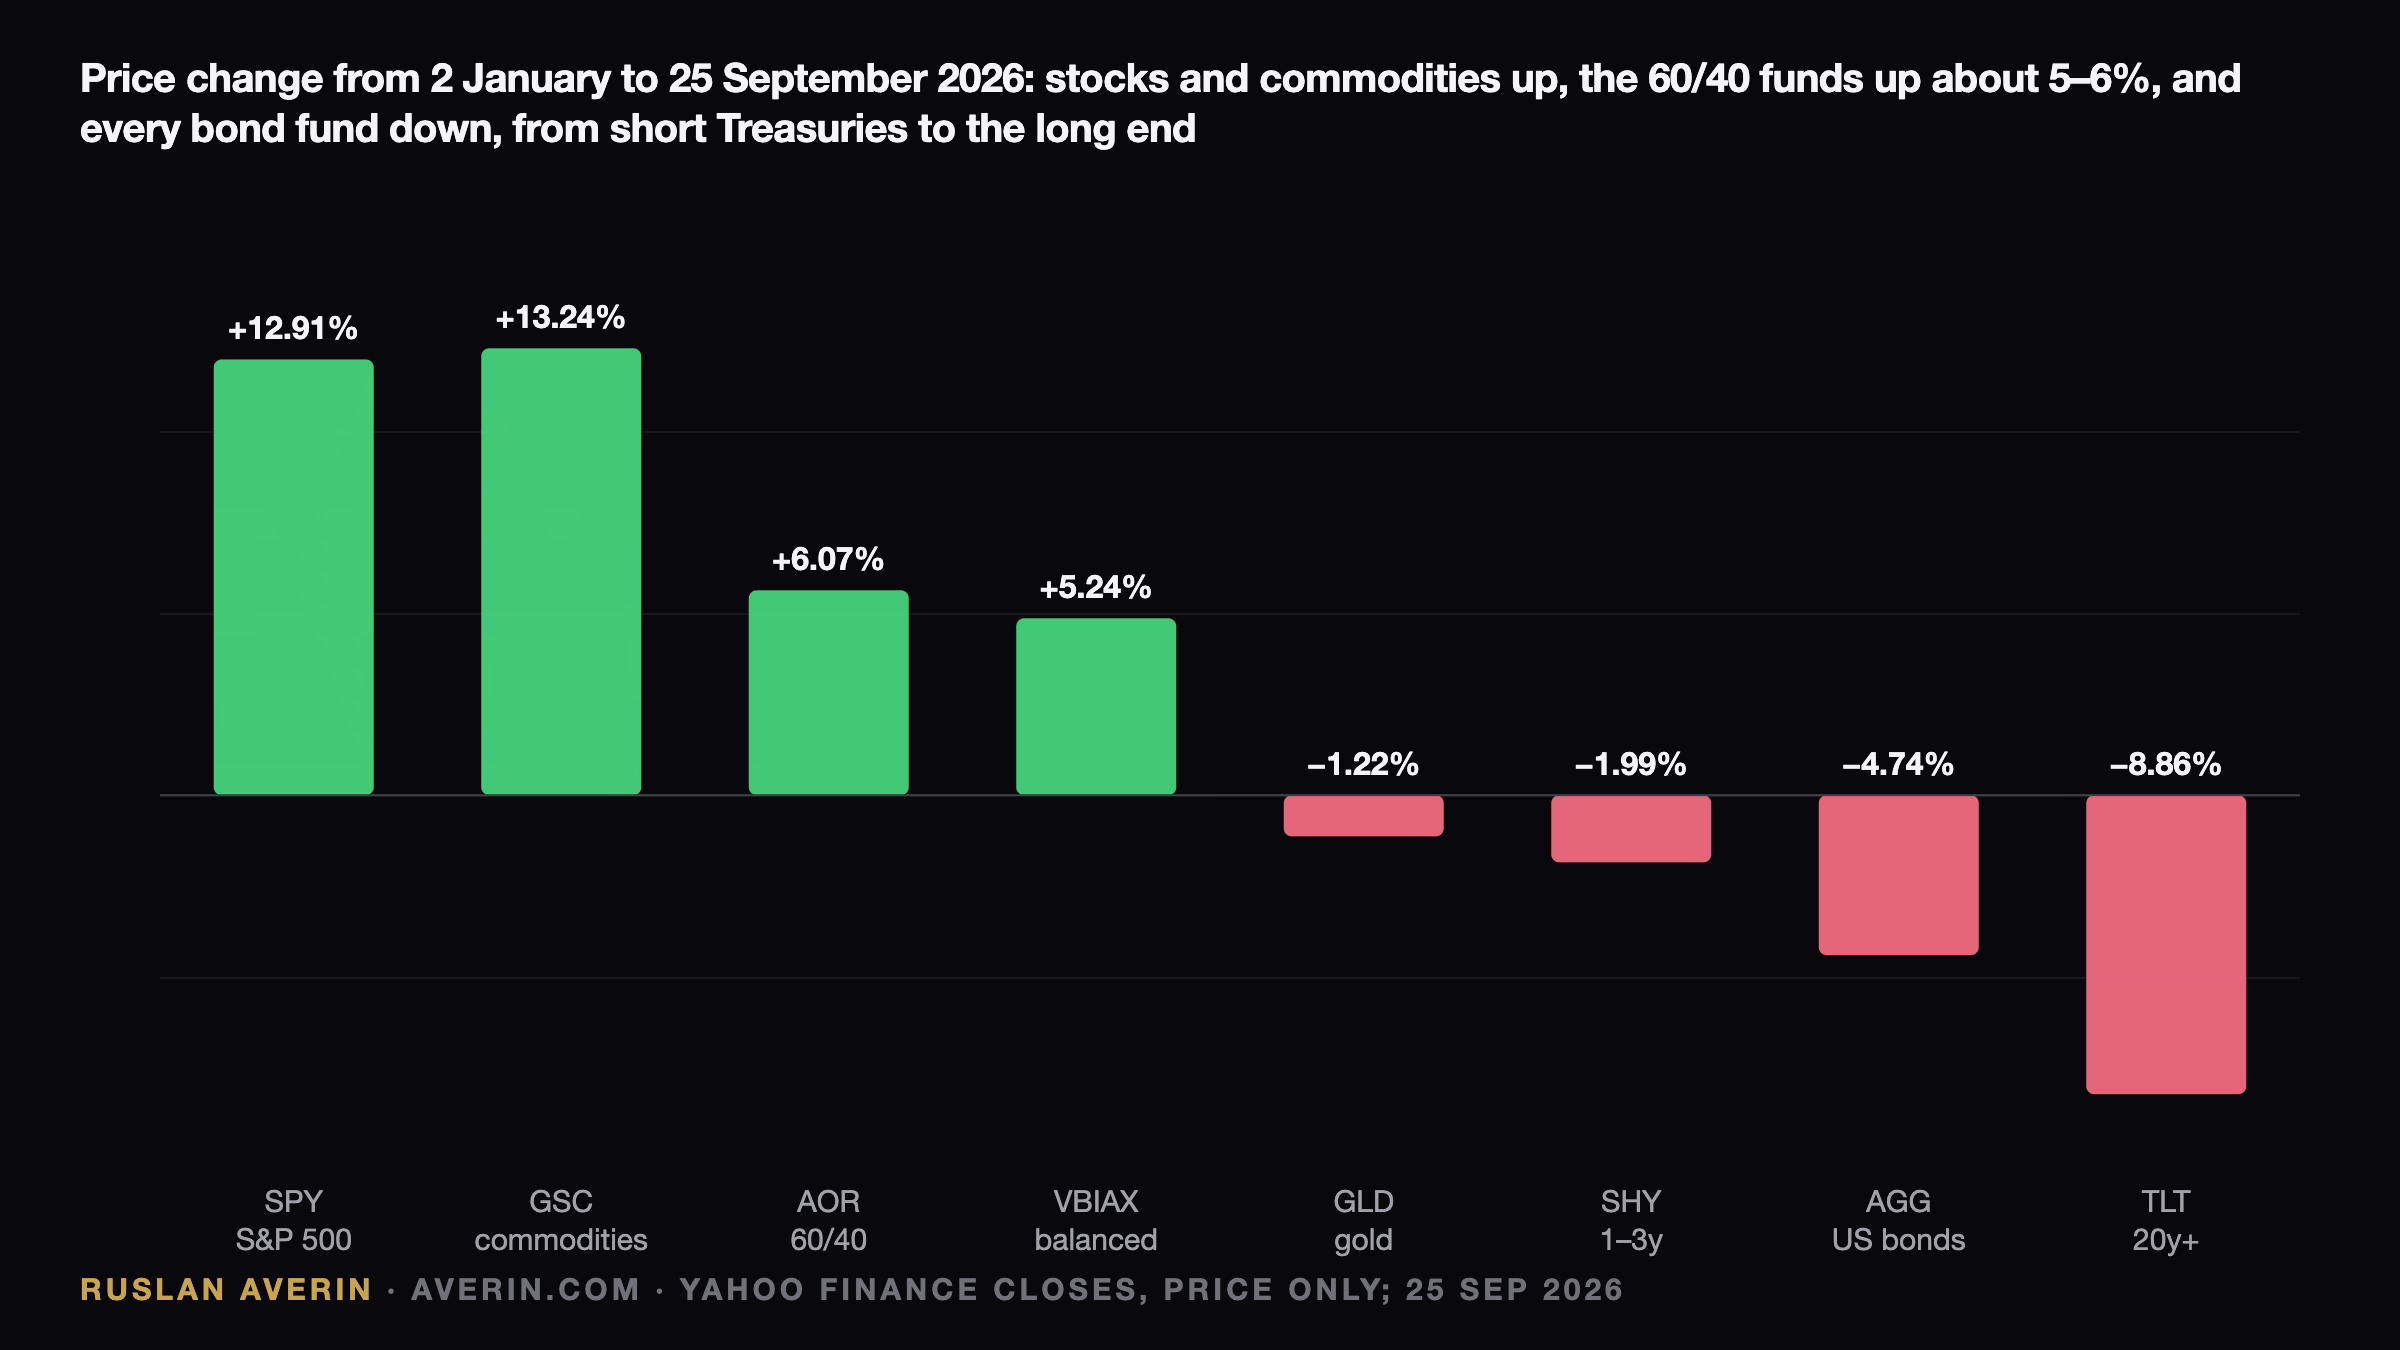
Nothing about 2026 resembles a crash. From the first trading day of the year through the close on 25 September, SPY gained 12.91% in price, and the S&P 500 finished at 7,743.41, less than 1% below its record of 7,798.99. The iShares Core 60/40 Balanced Allocation fund, AOR, added 6.07%, and Vanguard's Balanced Index fund, VBIAX, added 5.24%.
Underneath, the arithmetic is lopsided. Every unit of return came from equities. The aggregate bond fund AGG fell 4.74% in price, long Treasuries via TLT fell 8.86%, and even two-year paper lost ground, with SHY down 1.99%. Coupons recovered part of that, since AGG yields roughly 4–5% a year, but on price alone the "40" was a drag in a year when the "60" delivered.
| Asset, price change 2 Jan – 25 Sep 2026 | Change |
|---|---|
| S&P 500 ETF (SPY) | +12.91% |
| Commodities (GSC) | +13.24% |
| 60/40 fund (AOR) | +6.07% |
| Vanguard Balanced Index (VBIAX) | +5.24% |
| Gold (GLD) | −1.22% |
| 1–3 year Treasuries (SHY) | −1.99% |
| US aggregate bonds (AGG) | −4.74% |
| 20+ year Treasuries (TLT) | −8.86% |
September repeats the pattern in miniature. Month to date, SPY is up 1.26% while AGG is down 1.71% and TLT is down 3.11%. Over these four weeks, the bond allocation has not been insurance; it has been the loss-making line item.
Correlation Has Quietly Changed Regime
Morningstar's tally of months in which US stocks and bonds both lost money puts the frequency at 14% across 25 years, 28% over the last five years and 22% over the last three. For roughly two decades before 2022, Treasuries and equities were negatively correlated most of the time. Since 2022 they have tended to travel in the same direction, and 2022 itself produced the worst year for a 60/40 in a generation.
The mechanism is straightforward. Bonds hedge a growth scare: investors fleeing recession risk buy Treasuries, yields fall, prices rise. Bonds do not hedge an inflation or supply scare, because in that case rising yields are the reason equities are falling in the first place.
Three Drivers Behind the Rate Shock
CNBC's account of the week identifies the forces at work. First, sticky inflation, amplified by oil prices linked to the US-Iran war. Second, heavy supply: an estimated $132 billion of AI-related corporate debt from Alphabet, Amazon, Meta, Microsoft and Oracle through July, with Vanguard expecting $300–570 billion for the full year. Third, the expectation of at least one further Fed hike.
The Fed had already lifted the fed funds target to 3.75–4.00% on 16 September, with August consumer prices running 3.4% above a year earlier. The telling part is that yields kept rising after the hike, which points to supply and inflation pricing rather than fear of a policy error.
Bonds Now Bid Against Equities
The second shift runs in the opposite direction and favours fixed income. At 5.2%, the 10-year pays more than the index earns. The trailing earnings yield of the S&P 500 stood at 3.79% on 25 September, according to multpl.com, about 1.4 percentage points below the 10-year. On a trailing basis the equity risk premium is negative: for the first time in two decades, the index buyer collects less in earnings than the Treasury buyer collects in coupons. The 10-year TIPS yield sits 2.85% above inflation, and three-month bills pay 4.08%.
Steve Laipply, global co-head of iShares fixed income ETFs at BlackRock, told CNBC there is "potentially a really strong opportunity to lock in very attractive levels," calling it "a generational income opportunity." Dominic Pappalardo of Morningstar Wealth framed the mirror image: "Higher interest rates benefit savers and investors just as much as they're harming spenders." In March, BlackRock's strategists had all but buried the 60/40, arguing that government bonds offered "little refuge" during equity drawdowns. Both claims can hold simultaneously.
Splitting the "40" by Function
Rather than declaring the structure obsolete, analyst Ruslan Averin argues the bond sleeve should be divided according to the specific job each piece performs. Long Treasuries bought earlier are not worth dumping at a 19-year high in yields, but they no longer deserve to carry the shock-absorber role alone.
Locked income comes first: a 10-year purchased at 5.2% and held to maturity returns 5.2% a year in dollars whatever the interim price does. Liquidity comes second: bills at 4.08% and money-market funds have not lost a cent this year, while SHY fell 1.99%. Inflation protection comes third, through TIPS at 2.85% real and commodities, the only line in the table above that outpaced equities at +13.24%, in contrast to gold's 1.22% decline after its 2025 rally. Duration remains last, sized smaller, as insurance against a genuine growth scare.
The Trade to Avoid
The tempting conclusion, that bonds are finished and the whole 40 belongs in equities, is the one the numbers reject. With the trailing earnings yield below the 10-year and the S&P 500 within 1% of a record, that switch buys additional risk at a worse entry price. At these yields, fixed income has become the hurdle rate every competing asset, property included, now has to clear.