The question that arrives in the wrong order
Readers opening a first US index position almost always ask whether to buy VOO or VTI, and a recent Motley Fool article gave the debate fresh air by leaning towards VTI. The honest answer for anyone holding an account outside the United States is that this is the last decision in the chain, not the first. The funds cost the same 0.03% a year, share a manager, and have tracked each other with a correlation of 0.996 in monthly returns since 2010.
What separates the two portfolios
VOO tracks the S&P 500 with 516 holdings and roughly $1.09 trillion in assets, and it launched in September 2010. VTI tracks the CRSP US Total Market Index with 3,514 holdings and about $701 billion in the ETF share class alone, dating back to May 2001. On 25 September VOO closed at $710.79 and VTI at $379.77.
| Metric | VOO | VTI |
|---|---|---|
| Index | S&P 500 | CRSP US Total Market |
| Holdings | 516 | 3,514 |
| Expense ratio | 0.03% | 0.03% |
| Assets | $1.09 trillion | $701 billion |
| Top 10 holdings | 37.81% | 33.43% |
| Magnificent Seven | 33.53% | 29.60% |
| Trailing P/E | 27.05 | 26.32 |
| Dividend yield | 1.05% | 1.04% |
The roughly 3,000 additional names in VTI are mid- and small-cap companies weighted by market value. Because weighting follows size, those companies contribute a small share of the fund, which is why the two performance lines look nearly identical over most stretches.
The record does not crown a winner
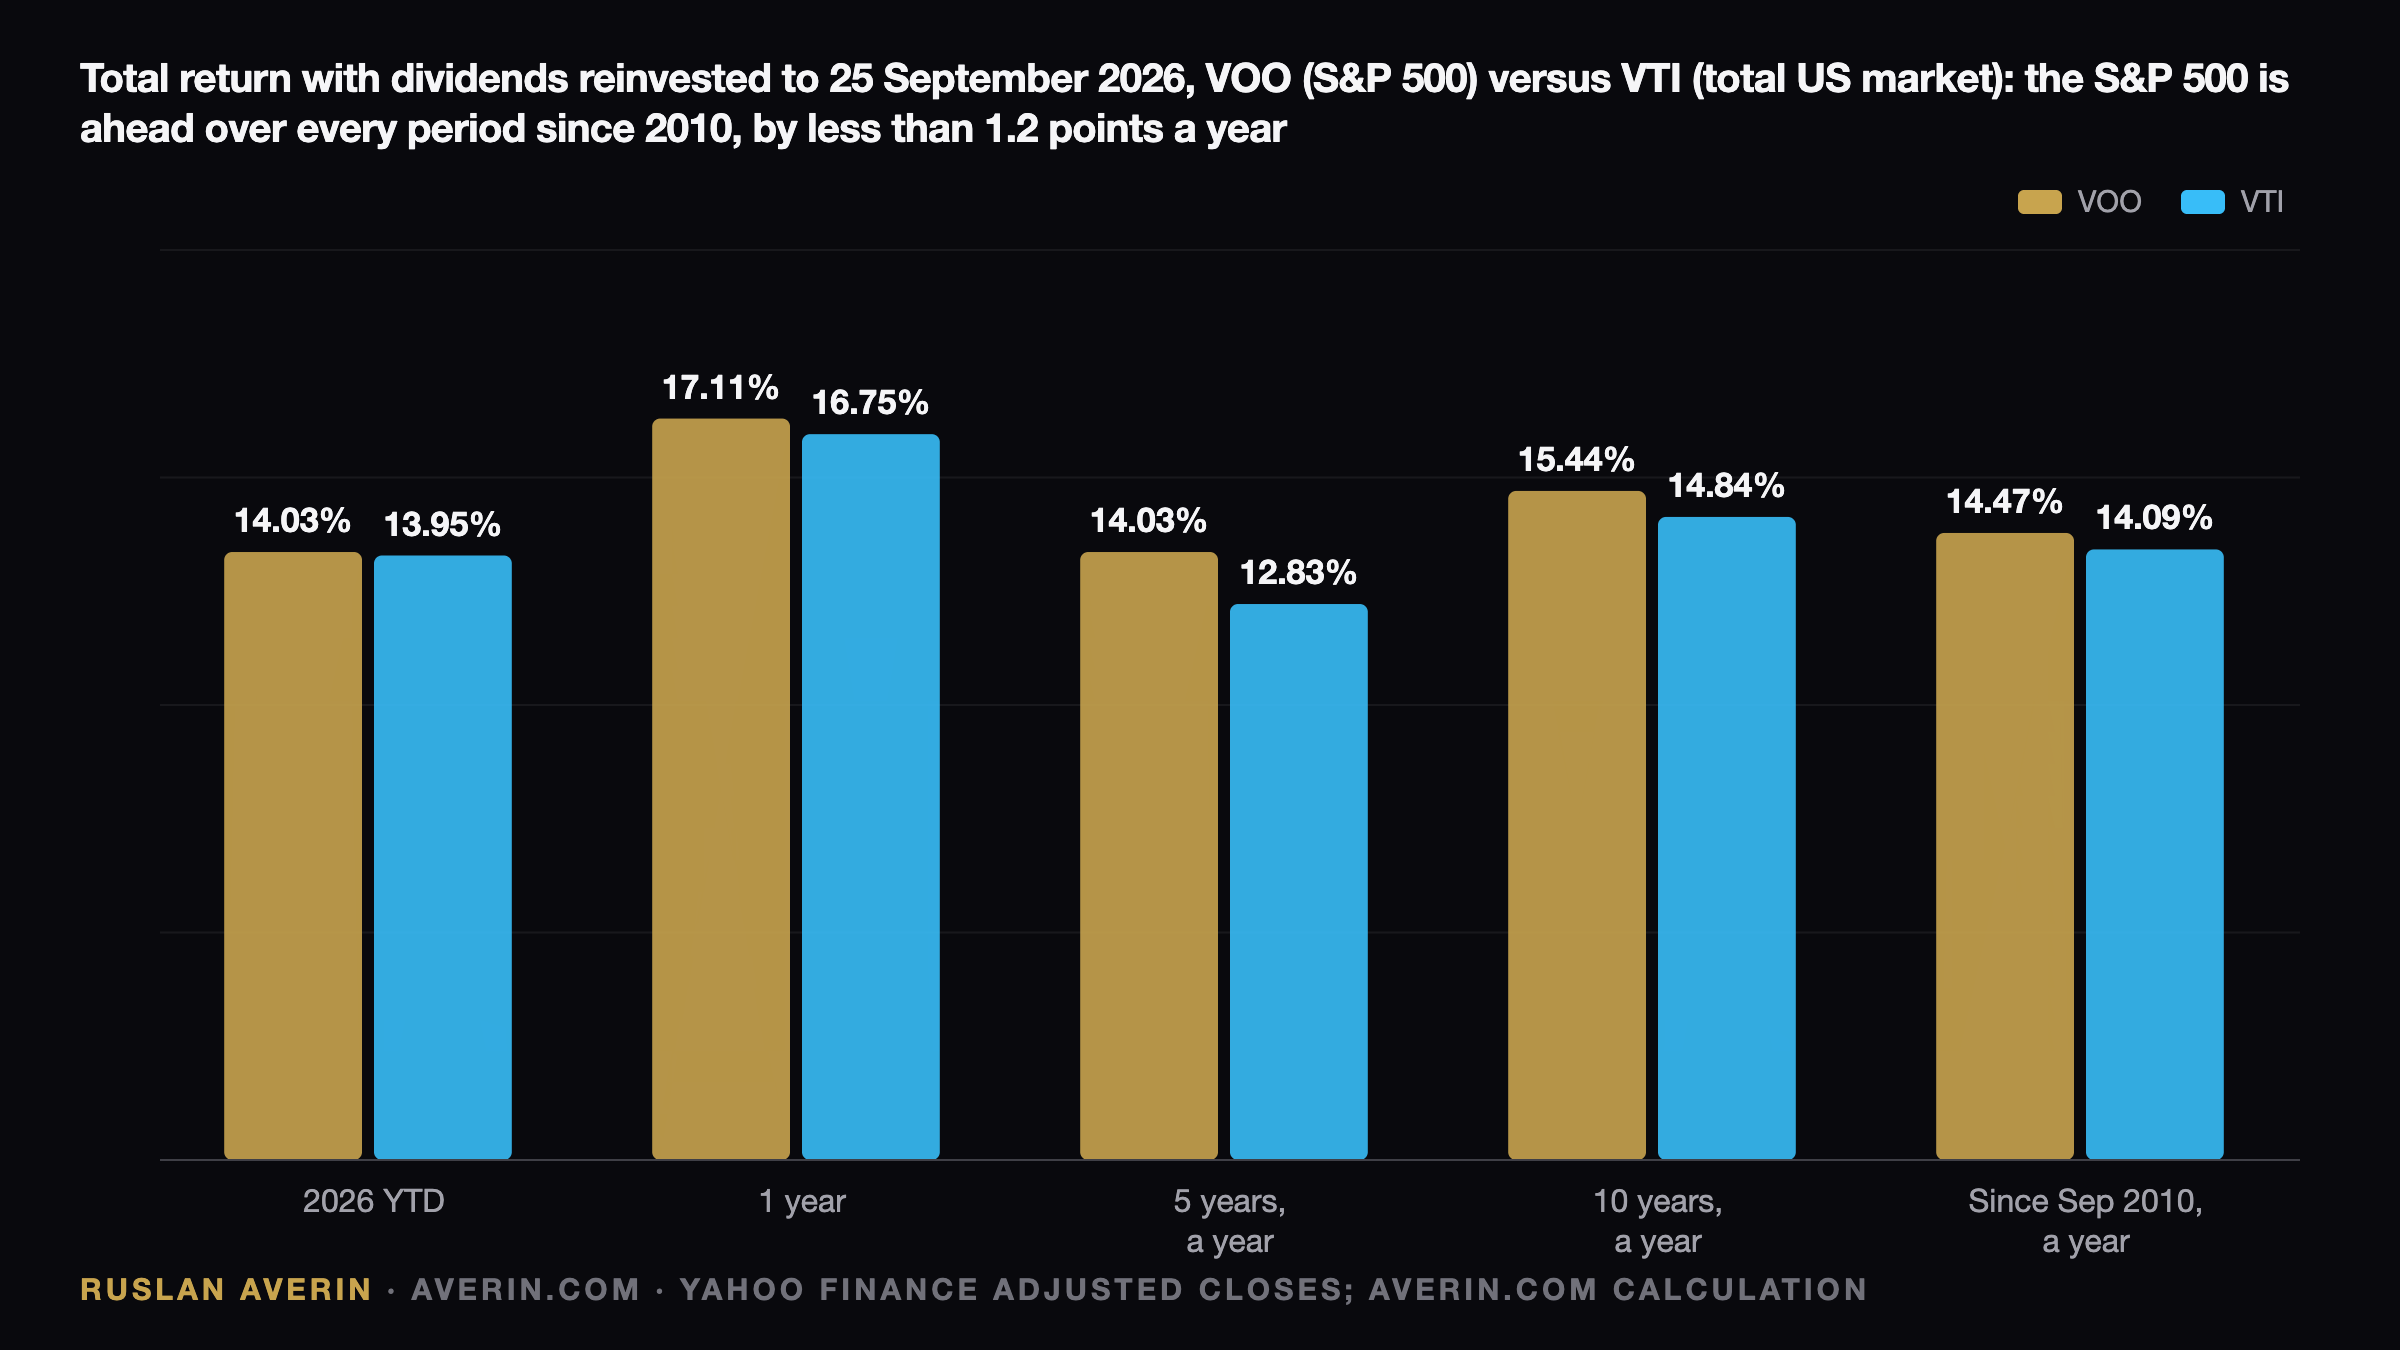
Since VOO's launch the large-cap index has led. From September 2010 to 25 September 2026 VOO returned 14.47% a year with dividends reinvested, against 14.09% for VTI. Over ten years the figures are 15.44% and 14.84%; over five years, 14.03% and 12.83%. Year to date the two are effectively tied at 14.03% and 13.95%.
Stretch the window and the ranking flips. Using SPY as a proxy for the S&P 500, VTI has returned 9.82% a year since 2001 against 9.56%, an advantage of 0.26 percentage points. That entire edge was earned from July 2001 to January 2011, when the total market compounded at 3.73% a year against 2.52% for the S&P 500 as smaller companies recovered from the dot-com bust. Between January 2015 and January 2025, in a mega-cap and AI-led market, the S&P 500 led 13.64% to 13.15%.
Concentration and price favour the broader fund
Two arguments support VTI today. The first is concentration: VOO's ten largest positions account for 37.81% of assets, with Nvidia at 8.08%, Apple at 7.03% and Microsoft at 5.70%, while the Magnificent Seven make up 33.53%. In VTI the same groups are 33.43% and 29.60%. The gap is about four percentage points, narrower than most investors assume, but it runs consistently in one direction.
The second argument is valuation. On trailing earnings the S&P 500 trades near 27 times, against 19.42 for the S&P MidCap 400, 18.81 for the Russell 2000 and 16.77 for the S&P SmallCap 600. David Dierking of the Motley Fool, who favours VTI, points out that the Russell 2000 is ahead of VOO by about 2% this year. A single year proves nothing, yet a large-company premium of that size resembles the setup that preceded the 2001–2011 reversal.
Access rules for European and Ukrainian buyers
Under the EU's PRIIPs regulation a fund must publish a key information document before it is sold to retail investors, and US issuers do not produce them for US-listed ETFs. EU-regulated brokers therefore cannot offer VOO or VTI to retail clients. The practical substitutes are Irish-domiciled UCITS funds: Vanguard S&P 500 UCITS in accumulating (VUAA) and distributing (VUSA) classes, and iShares Core S&P 500 UCITS (CSPX), each at 0.07% a year.
No UCITS product replicates VTI's breadth at comparable size and cost. The usual workaround is an S&P 500 UCITS fund paired with a separate US small-cap fund, or a global all-cap vehicle such as SPDR MSCI ACWI IMI at 0.17%, which is not a US-only exposure.
The tax arithmetic behind the wrapper
Shares of US-domiciled funds count as US-situs assets for a non-US person. Above $60,000 in value at death, the IRS requires an estate tax return, and absent a treaty the exemption is limited to that same $60,000. Irish-domiciled funds sit outside that regime, which settles the matter on its own for larger portfolios.
Dividends follow a second set of rules. With a W-8BEN form, US dividends paid to a Ukrainian resident face 15% withholding under the treaty rather than 30%. At home, foreign dividends are taxed at 9% plus the 5% military levy, and gains on sale at 18% plus 5%. An Irish accumulating fund still absorbs 15% US withholding internally, but distributes nothing, so no declaration arises until the shares are sold.
Ordering the decisions correctly
In analyst Ruslan Averin's view, the sequence for an investor outside the United States runs: domicile first, accumulation versus distribution second, index last. An accumulating Irish S&P 500 fund at 0.07% surrenders roughly 0.04 percentage points a year in cost relative to VOO while removing the estate-tax exposure completely.
For someone starting fresh with a 20-year horizon and no conviction on large versus small companies, VTI offers extra diversification at no extra cost. Switching an existing VOO holding is a different matter, since selling triggers tax on the gain. The VOO-versus-VTI spread, a few tenths of a percentage point a year in either direction, is smaller than the cost of choosing the wrong wrapper.