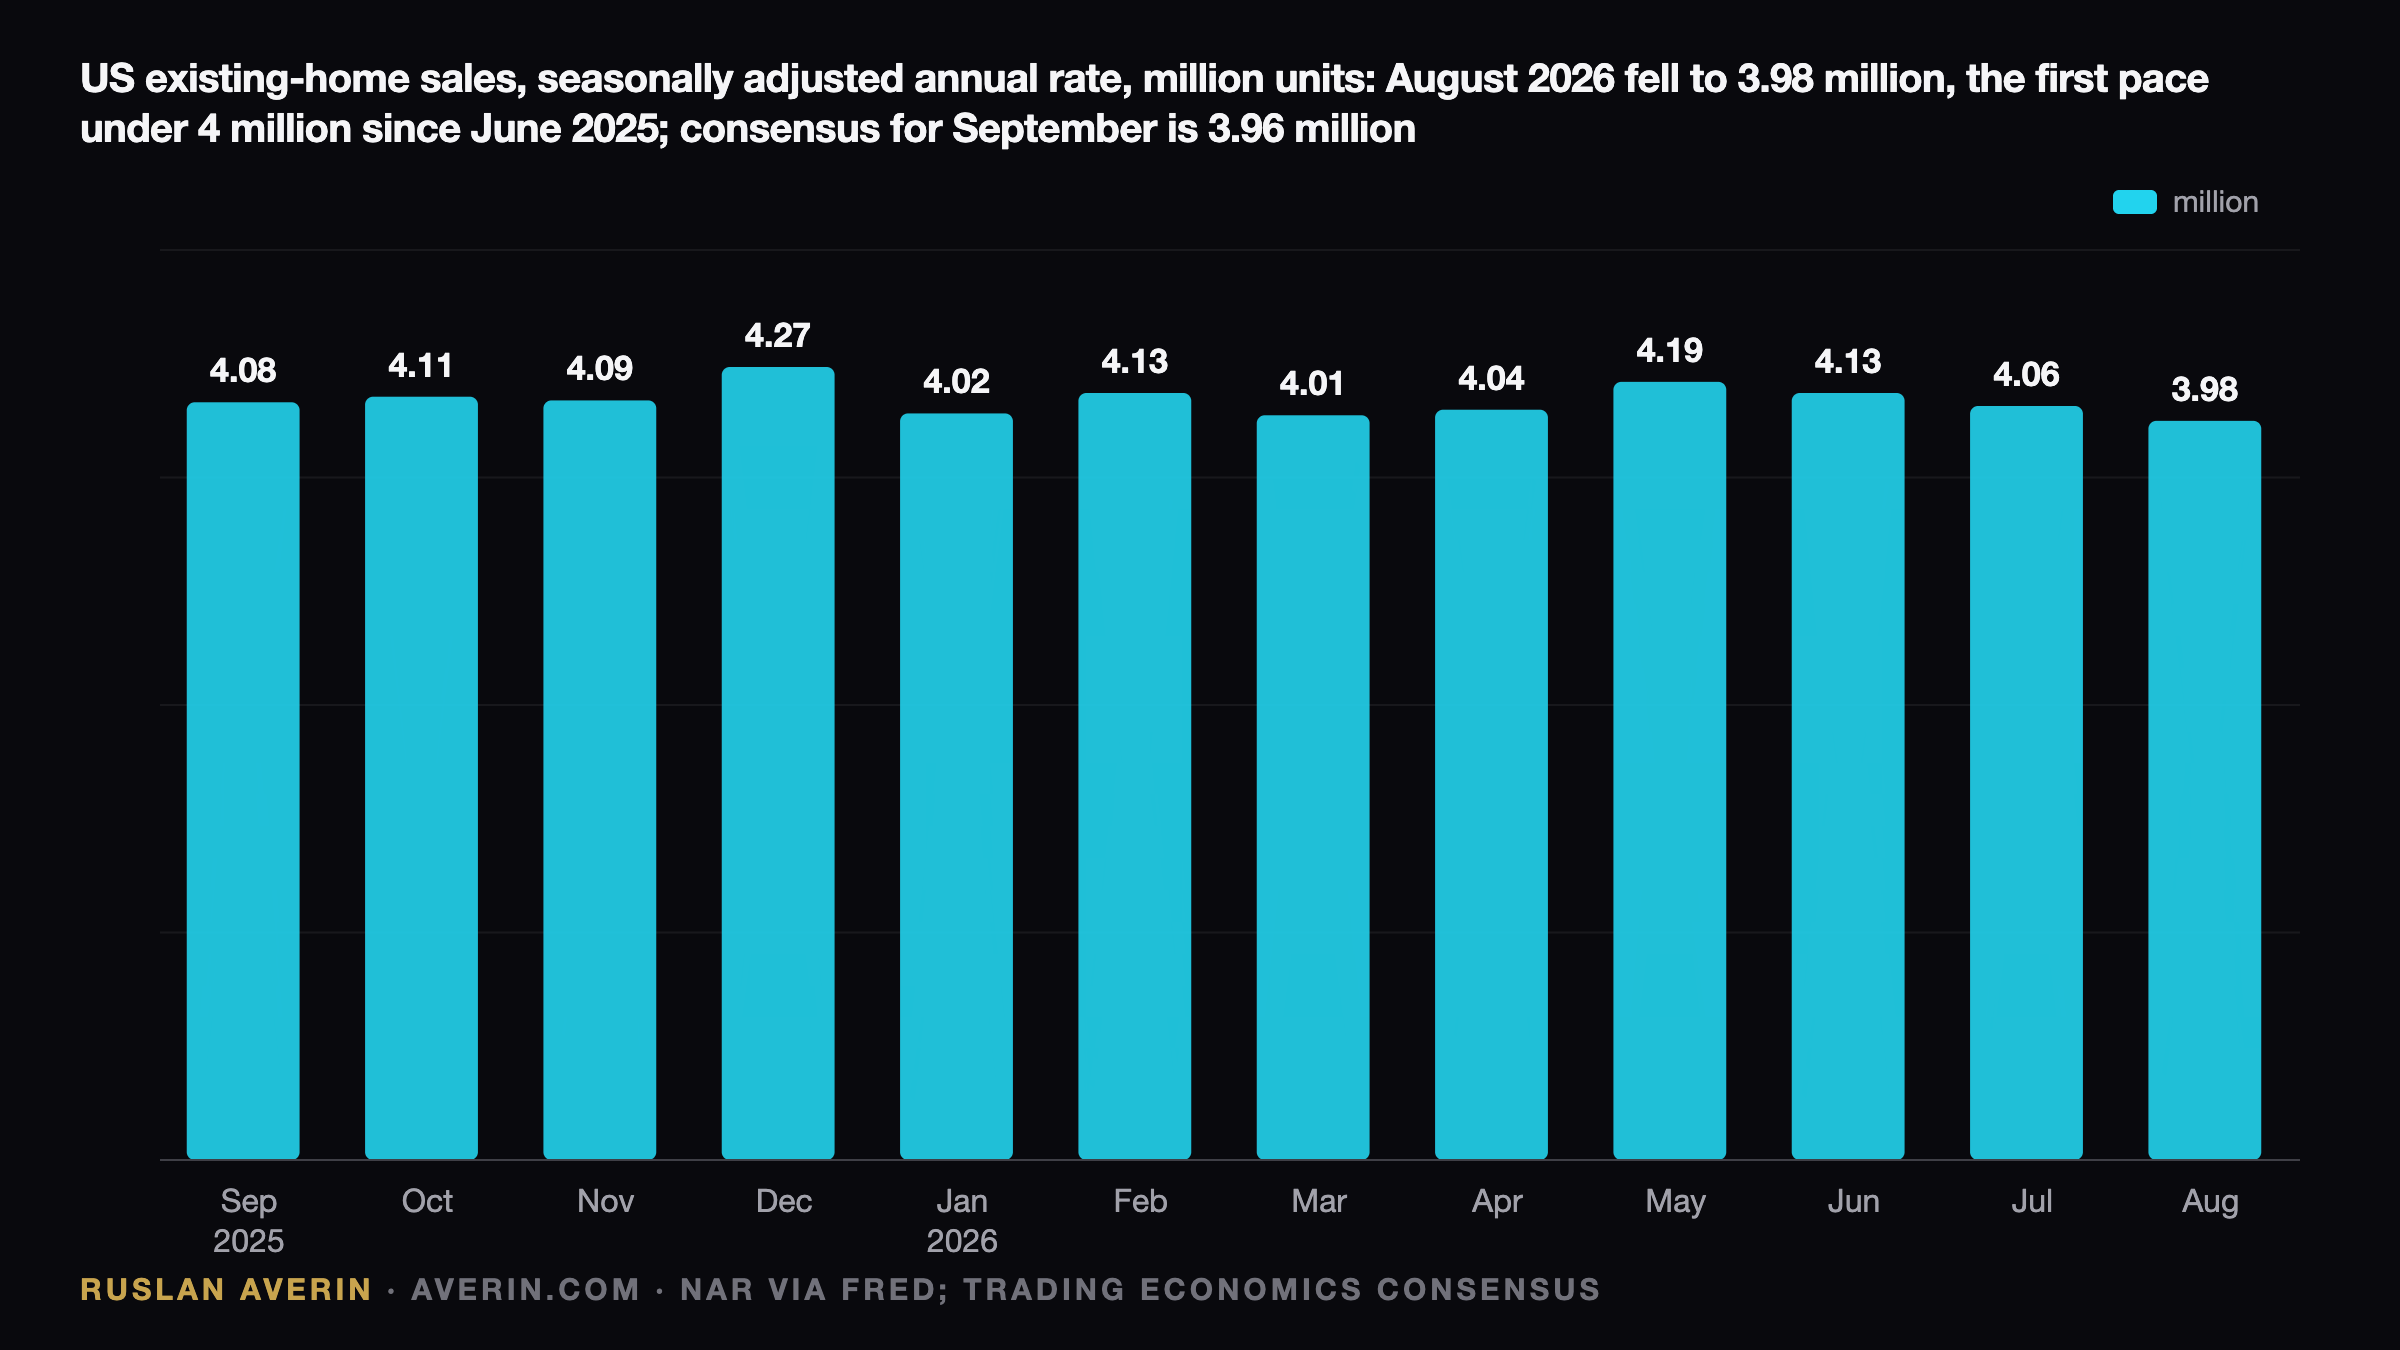
The National Association of Realtors publishes September existing-home sales on Tuesday 13 October 2026 at 10:00 a.m. Eastern time (14:00 GMT), the slot fixed in NAR's 2026 release schedule. Yet the most consequential housing number this week does not appear in that release at all: the 30-year mortgage rate averaged 7.40% on 8 October, the highest reading since November 2023.
The data window closed before the rate moved
The Trading Economics consensus points to a seasonally adjusted annual rate of 3.96 million, against 3.98 million in August. That would mark a second consecutive month below 4 million and roughly 2.9% fewer sales than the 4.08 million recorded in September 2025. Crucially, most September closings originated from contracts signed in July and August, when the 30-year rate averaged about 6.67%.
Seven consecutive weekly increases
Freddie Mac's Primary Mortgage Market Survey documents how fast financing costs turned. The 30-year fixed rate rose in every weekly print from late August onward, adding 0.74 percentage points over seven weeks.
| Week ending | 30-year fixed rate |
|---|---|
| 27 August | 6.66% |
| 3 September | 6.71% |
| 10 September | 6.76% |
| 17 September | 6.95% |
| 24 September | 7.03% |
| 1 October | 7.28% |
| 8 October | 7.40% |
For context, the rate stood at 6.30% on 9 October 2025 and at 5.98% on 26 February 2026, the low for the year. The 15-year rate reached 6.73%.
Bonds, not brokers, set the pace
The driver sits in fixed income. The 10-year Treasury yield touched 5% in mid-September, the highest since 2007, and closed at 5.22% on Thursday 8 October, up from 4.67% on 27 August. The Federal Reserve lifted its target range to 3.75–4.00% on 16 September. Mortgages amplified the move rather than simply tracking it.
The spread between the 30-year mortgage rate and the 10-year yield widened from about 1.99 percentage points at the end of August to 2.18 percentage points in the latest week. That widening typically signals mortgage-bond investors demanding extra compensation for rate volatility, and it means borrowers absorbed more than the Treasury move alone implied.
What the shift costs a household
On August's median price of $429,100 with 20% down, monthly principal and interest run about $2,208 at 6.67% and about $2,377 at 7.40%, a difference of roughly $169 a month or 7.7%. Measured against February's 5.98% low, financing the same house now costs about $323 a month more, a gap that reshapes qualifying incomes.
August set a soft baseline
NAR's August report, released on 10 September, showed sales down 2.0% from July to 3.98 million and down 1.2% year on year, the first pace under 4 million since June 2025. Single-family sales fell 1.9% to 3.62 million; condos and co-ops fell 2.7% to 360,000. The median price reached $429,100, up 1.6% from $422,400.
That marked a 38th consecutive month of annual price gains, though regional dispersion was wide. The Northeast median climbed 4.3% to $556,900 and the Midwest 3.3% to $340,400, while the South added only 0.7% to $366,500 and the West slipped 0.2% to $619,100.
Supply is the structural change
Inventory rose 3.2% on the month to 1.62 million homes, up 5.9% from a year earlier and above 1.6 million for the first time since November 2019. Months' supply climbed to 4.9 from 4.6, described by National Association of Home Builders economists as the highest since November 2015. Median time on market stretched to 31 days from 29.
The buyer mix tilted toward borrowers. First-time buyers took 30% of sales, up from 28% a year earlier, while all-cash deals eased to 27% from 28% in August 2025. Investors and second-home buyers dropped to 15% from 21%; distressed sales held at 2%. Lawrence Yun, NAR's chief economist, said simply: "Mortgage rates and home sales move in opposite directions."
The leading indicators already lean soft
Pending home sales, which precede closings by one to two months, rose 0.3% in August but sat 4.7% below a year earlier, following a revised 2.6% decline in July. The South gained 2.3% and the West 3.0%, while the Northeast fell 4.2% and the Midwest 1.6%. Yun noted signings are "roughly 30% below where they were in the years leading up to the pandemic."
Realtor.com's September report, published on 30 September, showed active listings up 5.4% year on year to 1,161,615, with 20.8% of listings carrying a price cut, a median list price of $419,250 (down 1.4%), and homes under contract down 4.1%. Chief economist Danielle Hale said buyers "are gaining leverage, but higher mortgage rates are limiting how much of that opportunity they can use."
Five lines worth checking on Tuesday
- Headline sales. Near 3.96 million is priced in; 3.90 million or below implies a deeper summer slowdown, while a return above 4.0 million suggests stronger closings.
- Median price. In 2025 the median fell 2.4% from August to September, to $412,300. A repeat gives about $419,000, still around 1.6% higher year on year; anything below $412,300 ends the 38-month streak.
- Months' supply. At 3.96 million sales and unchanged inventory of 1.62 million, supply holds at 4.9 months. A reading of 5.0 or higher strengthens negotiating power for buyers.
- First-time buyer share. August's 30% followed 29% in July and 28% a year earlier; a fall would show the rate spike hitting the most sensitive cohort.
- Cash share. At 27%, cash cushions the market. A rising share alongside weaker sales would mean financed demand is contracting faster than the headline.
Builders have already marked the move
The iShares U.S. Home Construction ETF closed at $92.36 on 1 September and at $84.76 on Friday 9 October, a decline of 8.2%. Lennar's September report, which cut full-year deliveries, set the tone. Over the same stretch the 10-year yield rose 0.43 percentage points, from 4.79% to 5.22%.
The link to resale data is indirect but real. A listing stock of 1.62 million with widening price cuts competes with new construction and caps pricing power unless builders fund incentives such as mortgage-rate buydowns, which erode margin. In analyst Ruslan Averin's view, Tuesday's print alone is unlikely to redirect the sector.
What matters after 13 October
The September Pending Home Sales Index, due Tuesday 20 October, will