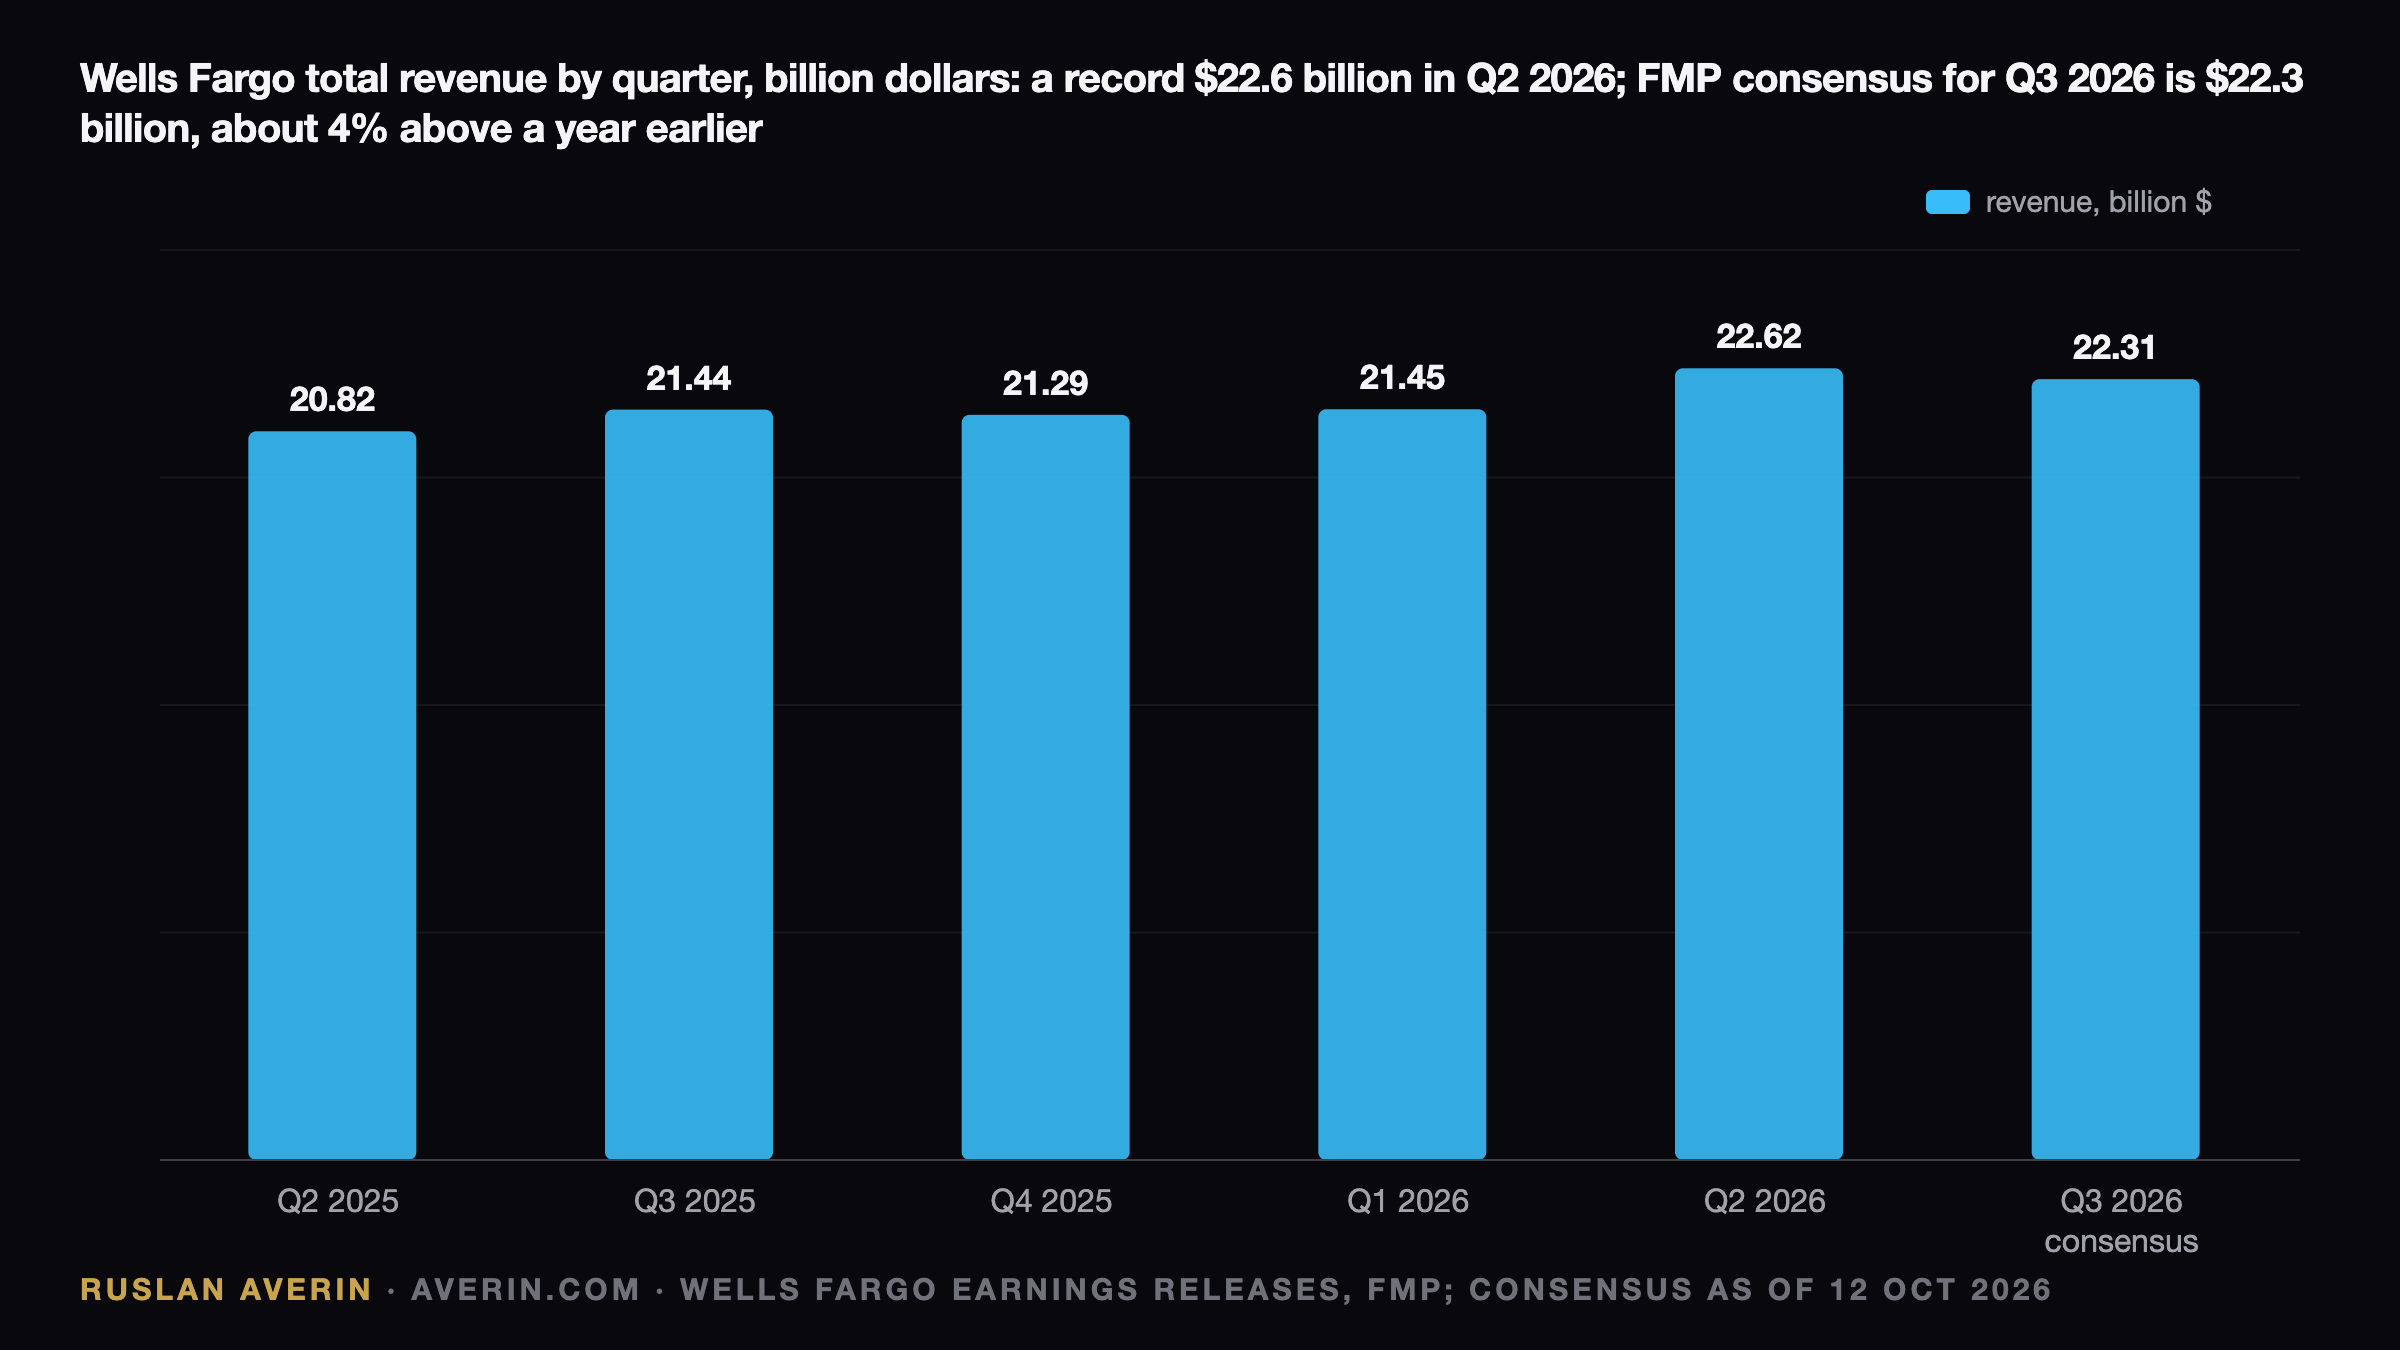
Three of the largest US banks open the reporting season on the morning of Tuesday 13 October, and only one of them arrives with a visible valuation problem. Wells Fargo has spent 2026 lagging its peers despite being freed from a regulatory constraint that held it back for seven years. The third-quarter print is the moment that gap either narrows or hardens.
Where the Stock Sits Before the Print
Shares closed on Friday 9 October at $83.55, down 10.4% from $93.20 at the end of 2025 and 13.3% below the closing high of $96.39 set on 6 January. Over the same stretch the KBW Bank index gained 3.9%. The divergence is unusual for a bank whose balance sheet is finally allowed to expand.
The selling has been methodical rather than panicked. On 14 July, the day of the second-quarter report, the stock fell 2.7% to $85.29 even though both EPS and revenue beat estimates. Between $89.72 on 15 September and $83.55 on 9 October it lost another 6.9%, roughly matching the KBW Bank index decline of 7.2%.
Capital Is Being Pulled in Two Directions
The second quarter saw 37.4 million shares repurchased, worth $3.0 billion, bringing first-half buybacks to about $7 billion. Management also signalled a third-quarter dividend increase to $0.50 a share from $0.45, a rise of 11%. Shareholder returns have stayed aggressive while the loan book expands.
Both activities consume the same capital. The CET1 ratio stood at 10.3% at the end of June, down from 11.1% a year earlier, as repurchases and balance-sheet growth absorbed the cushion. Any guidance on second-half buyback pace, or any hint of a lower CET1 floor, is likely to move the shares more than the headline EPS line.
The Arithmetic Behind the $50 Billion Target
Full-year 2026 guidance for net interest income was reaffirmed at roughly $50 billion in September. The first half produced $24.4 billion, split between $12.1 billion in the first quarter and $12.3 billion in the second. That leaves about $25.6 billion for the second half, or roughly $12.8 billion per quarter, a step up of about 4% from the second-quarter level.
| Metric | Q2 2026 actual | What the second half requires |
|---|---|---|
| Net interest income | $12.3 billion | about $12.8 billion a quarter |
| Noninterest expense | $13.7 billion | about $13.85 billion a quarter |
| Efficiency ratio | 60% | at or below 62% |
| ROTCE | 17.7% | 16–17% seen as a solid outcome |
The rate backdrop is supportive on paper. The Fed's target range has been 3.75–4.00% since 16 September, and the 10-year Treasury closed at 5.24% on 9 October. The complication is deposit mix: in July management said loan growth exceeded expectations while noninterest-bearing deposits grew less than hoped, which pressures the spread.
Life After the Asset Cap
The Federal Reserve removed the cap on 3 June 2025 after it had frozen total assets since 2018. Chief executive Charlie Scharf framed the change in July as the end of an unequal contest: "After years of not being on a level playing field with our competitors because we couldn't grow our balance sheet", the bank was now growing it.
Average loans in the second quarter reached $1,026.5 billion, up 12% year on year, with average deposits of $1,465.6 billion, up 10%. On 15 September at the Barclays conference, chief financial officer Mike Santomassimo said 2026 loan growth would beat the earlier mid-single-digit percentage forecast and that the third-quarter net interest margin was tracking better than first expected.
He also guided investment banking fees and Markets revenue each to rise by a mid-single-digit percentage in the quarter, and described consumer credit as healthy: "Debt-to-income levels are quite good overall." The test on Tuesday is whether loan growth still exceeds 10% and whether it comes from lending with real spread rather than from the Markets balance sheet.
Costs, Returns and the Benchmark Quarter
Expense discipline remains Scharf's primary lever. Second-quarter noninterest expense was $13.7 billion, up 2%, while the efficiency ratio improved to 60% from 64% a year earlier. Full-year expense guidance of about $55.7 billion was left unchanged in September; with $28.0 billion spent in the first half, roughly $27.7 billion remains, or around $13.85 billion a quarter.
Return on tangible common equity hit 17.7% in the second quarter, inside the medium-term 17–18% target, but the first quarter was only 14.5%. Scharf has committed only to reaching a regular return in that band within "a reasonable period of time". A clean reading of 16–17% would reassure; a slide back toward 14.5% would reopen the debate.
The Bar Set by Consensus
Financial Modeling Prep's consensus from 13 analysts is EPS of $1.85 on revenue of $22.3 billion. Revenue a year earlier was $21.4 billion, so the forecast implies growth of about 4%, well short of the 9% delivered in the second quarter. The bar looks deliberately modest.
The comparison base is demanding. Second-quarter net income was $6.4 billion with diluted EPS of $2.00, up 25% from $1.60, helped by a $132 million discrete tax benefit worth $0.04 a share. Revenue of $22.6 billion rose 9%, with net interest income up 5% to $12.3 billion and noninterest income up 13% to $10.3 billion.
Four Lines That Decide the Reaction
In analyst Ruslan Averin's view, the market will read four items before anything else: net interest income near $12.8 billion with the $50 billion guidance held or raised; average loan growth still above 10% year on year; an efficiency ratio at or below 62% with full-year expenses near $55.7 billion; and buybacks of at least $3 billion in the quarter.
If all four land, the sector discount can begin to close, since a 10.4% decline this year has already priced in disappointment. If NII arrives near $12.3 billion and guidance is trimmed, the post-cap story reads as balance-sheet expansion rather than earnings growth, and the discount persists. With JPMorgan and Citigroup reporting the same morning, the relative move will matter as much as the absolute one.