One number explains the whole drawdown
The cleanest way to read gold at $4,285 an ounce on 15 September 2026 is not through the headlines but through the 10-year inflation-protected Treasury yield. It stood at 1.90% on 28 January, the day the metal printed its $5,589 record. It was 2.41% on 14 August. On 15 September it reached 2.63%, after the nominal 10-year touched 5.04%, its highest since 2007.
That is a 70 basis point increase in the guaranteed real return on the risk-free asset. Gold pays no coupon, so the rise is a direct cost of ownership, and the metal has paid it in full: a 23% drawdown from the record, and a price now marginally below the end-2025 close of $4,315.
Three weeks of the same story
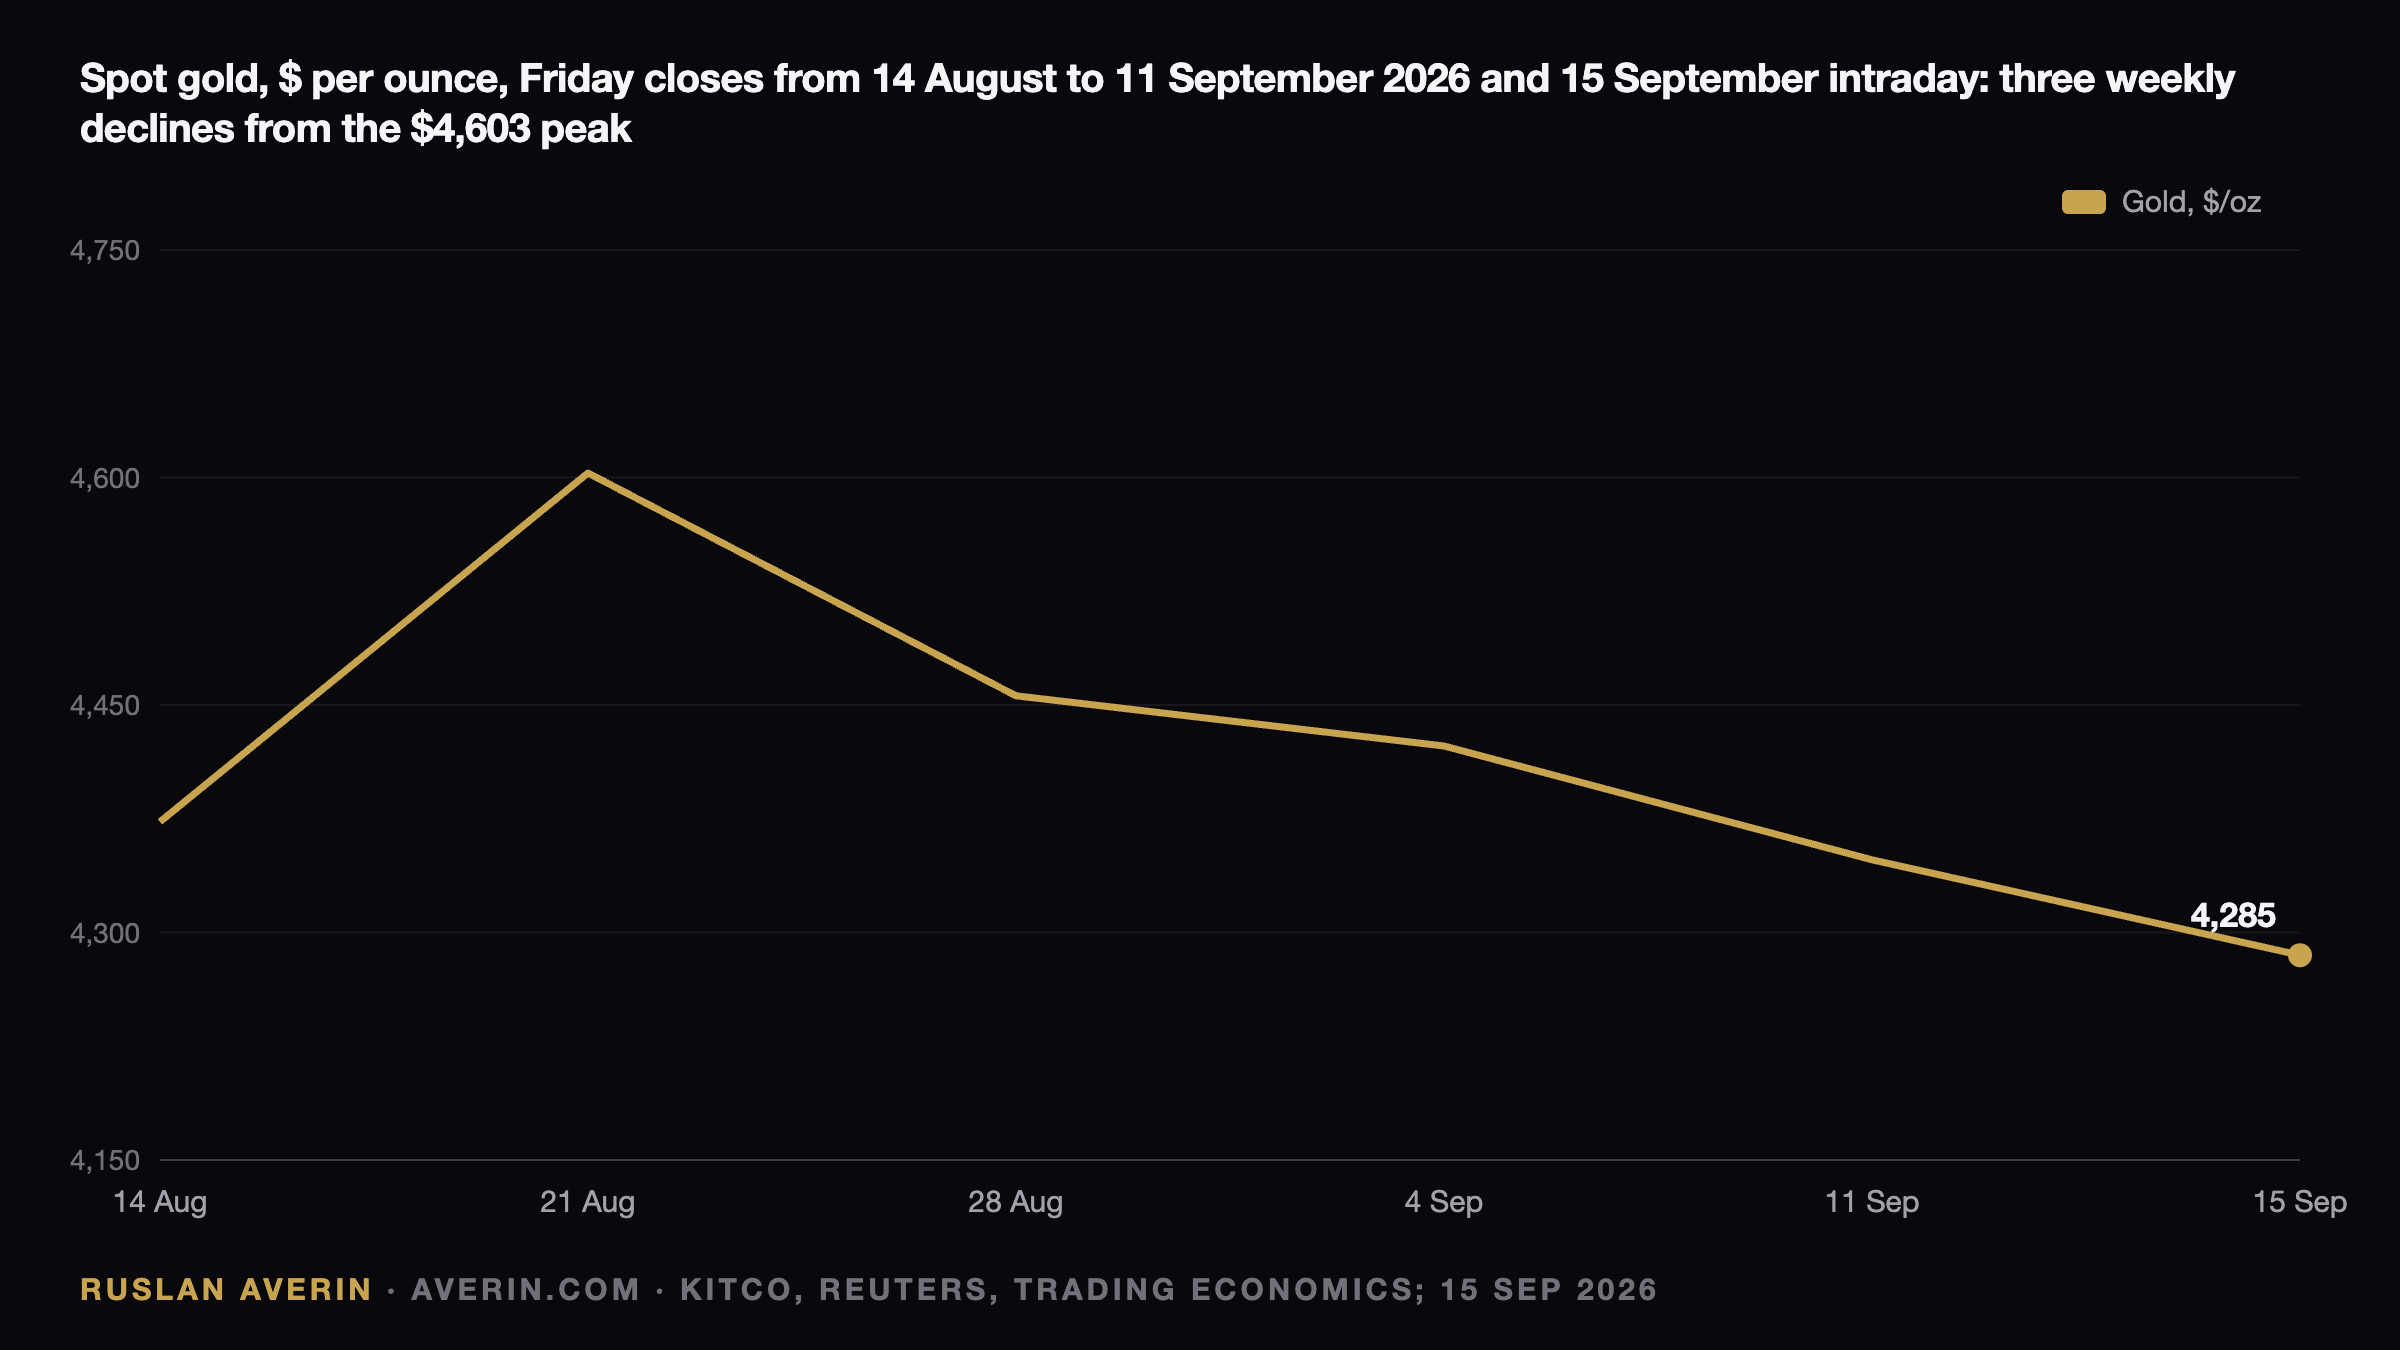
Gold has closed lower for three consecutive weeks, shedding roughly 5.5% since the $4,603 close on 21 August. It has now spent two sessions below $4,300 and sits at its lowest since early August, with the Federal Reserve's first rate increase since 2023 scheduled for 2:00 pm New York time on Wednesday.
| Week ending | Spot close | Move | Driver |
|---|---|---|---|
| 14 August | $4,373 | +0.5% | weak retail sales cut hike odds to 29% |
| 21 August | $4,603 | about +5% | third weekly gain, dollar index below 99 |
| 28 August | $4,456 | −3.1% on the Friday | Warsh at Jackson Hole revives the September hike |
| 4 September | about $4,423 | mild decline | payrolls +162,000 against +53,000 expected |
| 11 September | $4,348 | −1.8% | PPI 5.4%, CPI core +0.3%, hike odds 87% |
| 15 September, intraday | $4,285, low $4,263 | −1.5% from Friday | oil above $105, 10-year at 5%, hike odds 92% |
The implied probability of a hike on CME futures tracks the chart in mirror image: 29% on 14 August, 36% before Warsh spoke, 58% after, 65% following payrolls, about 60% on 10 September, 87–90% after the CPI release on 11 September and 92–93% on 14–15 September.
Oil flipped from hedge to headwind
Brent moved from $88 in mid-August to $108 after the shutdown of Saudi Arabia's East-West pipeline on 11 September. Textbook logic makes that bullish for an inflation hedge. Markets read it the other way.
UBS analyst Giovanni Staunovo noted on 14 September that "the renewed rise in oil prices could reinforce inflation concerns and keep the Fed on a hawkish footing". Jim Wyckoff argued the same day that higher crude "suggests the major central banks of the world are going to have to tighten their monetary policies to control inflation, and that's bearish for the metals". The European Central Bank already lifted its rate to 2.50% on 10 September, and the Bank of Japan is expected to act on Friday.
The dollar deserves less blame than it gets. The dollar index was 99.3–99.6 on 15 September, an over-one-week high on a fourth straight gain, but essentially unchanged from mid-August and only about 1% above the sub-99 level that accompanied the August peak.
The flow data contradict the price
August was the second-largest month on record for gold ETFs: $18 billion, or 121 tonnes, taking global holdings to a record 4,189 tonnes and assets under management to $615 billion. Europe posted its biggest month ever at $7.9 billion, with the United Kingdom alone contributing $4.4 billion, while North America added $7.7 billion. Year-to-date inflows total 160 tonnes.
Official buyers remain present. July saw net central-bank purchases of 23 tonnes: China added 20 tonnes in a 21st consecutive month, lifting reserves to 2,366 tonnes and 60 tonnes for the year; Poland bought 8 tonnes to reach 640, against a stated target of 700; the Czech Republic added 2 tonnes in a 41st month. Russia and Turkey were net sellers. Official-sector demand for 2026 runs near 130 tonnes versus 160 tonnes in the same period of 2025.
The selling is speculative. CFTC data put managed-money net longs on Comex gold at 134,972 contracts on 8 September, down about 9,800, or 6.8%, in two weeks, with 145,804 longs against only 10,832 shorts. That remains a crowded long book, and if $4,265 breaks there is more to unwind.
Where the chart breaks
Gold is pinned to its 50-day moving average at $4,267–4,271 and the 61.8% retracement of the July–August rally at $4,292. Below sit $4,263, the 15 September intraday low, then the lower Bollinger band at $4,230, followed by $4,216, $4,203, $4,196 and the $4,000 area that marks the low for the year. Resistance runs through the 100-day average at $4,331, then $4,369, $4,447 and the 200-day at $4,539; FXEmpire treats the chart as bearish below $4,530.
Silver has suffered more, slipping to $63.2 from $69 on 21 August, including a 5.6% fall on 10 September alone. Platinum trades at $1,769. Producers have lagged the metal: Newmont at $121.87 is down 16% in three months from its $134.86 record on 25 August, GDX sits at $93 against a 52-week high of $117.18, and Agnico and Kinross are down 33% and 29% respectively over three months.
Sell-side targets, mostly written before the hike
Goldman Sachs published $4,900 for end-2026 on 19 June, with $4,400 if the Fed hikes. UBS on 10 September assumed two hikes and modelled $4,600 for December 2026, $5,000 for March 2027 and $5,200 for June 2027. JPMorgan cut its 2026 average to $5,243 from $5,708 on 18 June. Commerzbank trimmed end-2026 to $4,800 from $5,000 on 3 June, citing the oil shock. Citi on 9 June lowered its near-term call to $4,000 from $4,300.
Goldman's conditional path now matters most, because the hike has become the base case; the bank describes itself as "structurally constructive but tactically cautious, with near-term downside risk and medium-term upside risk". The World Gold Council's August commentary conceded that "what a hike achieves isn't clear and on paper wouldn't be great for gold". Kitco's weekly survey still found 64% of Wall Street analysts bullish, with Marc Chandler citing $4,460–4,510 as a technical objective "however, the outcome of the Fed meeting is the key".
The dot plot is the trade
The decision itself is priced at 92–93%. The projections are not. A median showing two further hikes in 2026 gives real yields another leg and puts $4,200 in play with the $4,000 low behind it. A one-and-done signal would apply the October 2023 Treasury script to gold, making the 200-day average at $4,539 the first target.
Analyst Ruslan Averin argues the asymmetry sits in the flow data: record ETF holdings and an uninterrupted central-bank bid form a floor that did not exist at the 2023 lows, while the speculative book has already surrendered a third of its August build. On that reading, holding without adding into Wednesday afternoon is the disciplined stance.
Averin also frames gold this week as the same trade as the 10-year Treasury: both instruments price the identical real yield and both hinge on the same press conference. The distinction is straightforward — the bond pays 5% during the wait.